Safety Information
Electrical Safety
Electrical Specification USB Port Input Voltage: 5VDC, ±0.5V Input Current: 400mA Max Solar or External Supply Input 5 -10 VDC SDI-12 Output Signal Voltage: Typically, 0-5VDC Power Output Voltage: 12VDC Short Circuit Current: 400mA ±20%
Operation Safety
Before installation of the system, carefully read all manuals and documentation regarding the contents of the packages sent. Before use, ensure all products are free and clear of any damage, especially to the mainboards and battery terminals. If any damage or defects are visible, contact your dealer immediately. Avoid short circuits by keeping any loose metals, screws, or paper clips away from the inner workings of the products. Avoid allowing internal components to be exposed to dust, water, and extreme temperatures. The operating temperature range is 5° C to 45°C.
Environmental Operating Temperature:
Humidity: 0 to 90% RH, Non-condensing
-10 to +50°C (+14 to +122°F)
Note: This limitation comes from the lithium-ion cell.
Note: The Acclima Solar Node has physical limitations on what temperature range it will fully operate in. If it will be used in freezing weather (< 1°C or < 33°F) for extended periods, the end-user should plan to periodically have the lithium-ion 18650 battery swapped out for a fully charged replacement because the battery charging circuit is disabled at (0°C or 32°F). The battery will still run the data logger for the duration of the remaining charge but will not be recharged at or below those temperatures. When recharging backup batteries in a desktop charger, care should be taken to allow the batteries to warm up to room temperature before recharging them or the battery could be permanently damaged. Similarly, if the temperature inside the enclosure exceeds (50°C or 122°F) the battery will stop charging.
Introduction
The Acclima Solar Node and Gateway are simple-to-use wireless data recorders that work together to provide the user access to captured SDI-12 sensor data in the cloud. They provide the ability to read and log data from a variety of SDI-12 sensors. Conveniently, data is collected and transmitted over the air via long-range radio, then forwarded to the cloud via LTE cellular networks. Each Solar Node supports up to ten SDI-12 sensors and each Solar Gateway supports up to ten Nodes. The Solar Node records all the measurements of the SDI-12 devices. The Solar Gateway collects this information and makes it available to suit the user’s needs online at data.acclima.com.
About This Guide
In this guide, you will find information about the Acclima Solar Node and Gateway. Notably, you will find our recommendations for the installation and use of the Node and Gateway system. The guide contains real photos, artistic interpretations, 3D models, CG renders, and illustrations. All graphics contained in this guide are for example’s sake, are subject to change, and are not always to scale. Therefore, these images will not be labeled by figure.
How This Guide is Organized
This guide includes the following components:
- Product Information
- Basic Installation
- Device Software
- Field Installation
- Support/Warranty
Items you may need:
Flighted Auger 1-3/4″ x drill bit
28”-30” drill bit extension
20-40v power drill
Flathead Screwdriver 1/8”
8-10ft 1 ¼ inch Sch 40 PVC per Gateway or Node (straight pipe) (Type 1)
2 ½ to 3ft (lower) + 6-8’ (upper) per Node (sectional) (Type II)
3-way 1 ¼ inch SCH 40 PVC Tee Fitting connector per Node (sectional) (Type III)
64bit Windows™ 7, or newer PC
| Node | Gateway |
|---|---|
| Weather Resistant Enclosure | Weather Resistant Enclosure |
| Solar Powered Recharging 3.7-volt Lithium-ion cell Battery 3,500mAh | Solar Powered Recharging 3.7-volt for the Lithium-ion cell Battery 3,500mAh |
| Recharging is supported for temperatures between 5° C to 45°C | Recharging is supported for temperatures 5° C to 45°C |
| Min & Max operating temperatures –20° C to 60° C | Min & Max operating temperatures –20° C to 60° C |
| Five SDI-12 connectors Support for 10 devices at 12v | LoRa Radio Transceiver Cellular Radio Transceiver |
| Maximum Power Draw: 5 watts | Support for up to 10 Node Connections |
| Maximum record retention before overwriting: 56,000 logs | 8GB Micro SD card Memory Expansion |
| Records all M! command inputs | Cellular Networks: GSM |
| LoRa Radio Transceiver | Cellular technology 2G, CAT-M1 (4G LTE) |
| Standard Range Mode: 0-2 miles Line-of-Sight Data rate: 201.4 b/s Range: up to 2 miles | Complete packet forwarding to Acclima Cloud <5-minute latency |
| Long Range Mode: 2-5 miles Line-of-Sight Data rate: 66.5 b/s Range: up to 5 miles | Scanning/Forwarding @ 30-minute intervals |
| Radio frequency: 902 – 928 MHz (Frequency Hopping Spread Spectrum) | Radio frequency: 902 – 928 MHz (Frequency Hopping Spread Spectrum) |
| Dimensions: Height 12.5″(w/Antenna) 7.00″ (w/o Antenna) Width 6.63″ Depth: 4.63″ Weight: 2.25 lbs Package: 3.0 lbs | Dimensions: Height 12.5″(w/Antenna) 7.00″ (w/o Antenna) Width 6.63″ Depth: 4.63″ Weight: 2.20 lbs Package: 2.65 lbs |
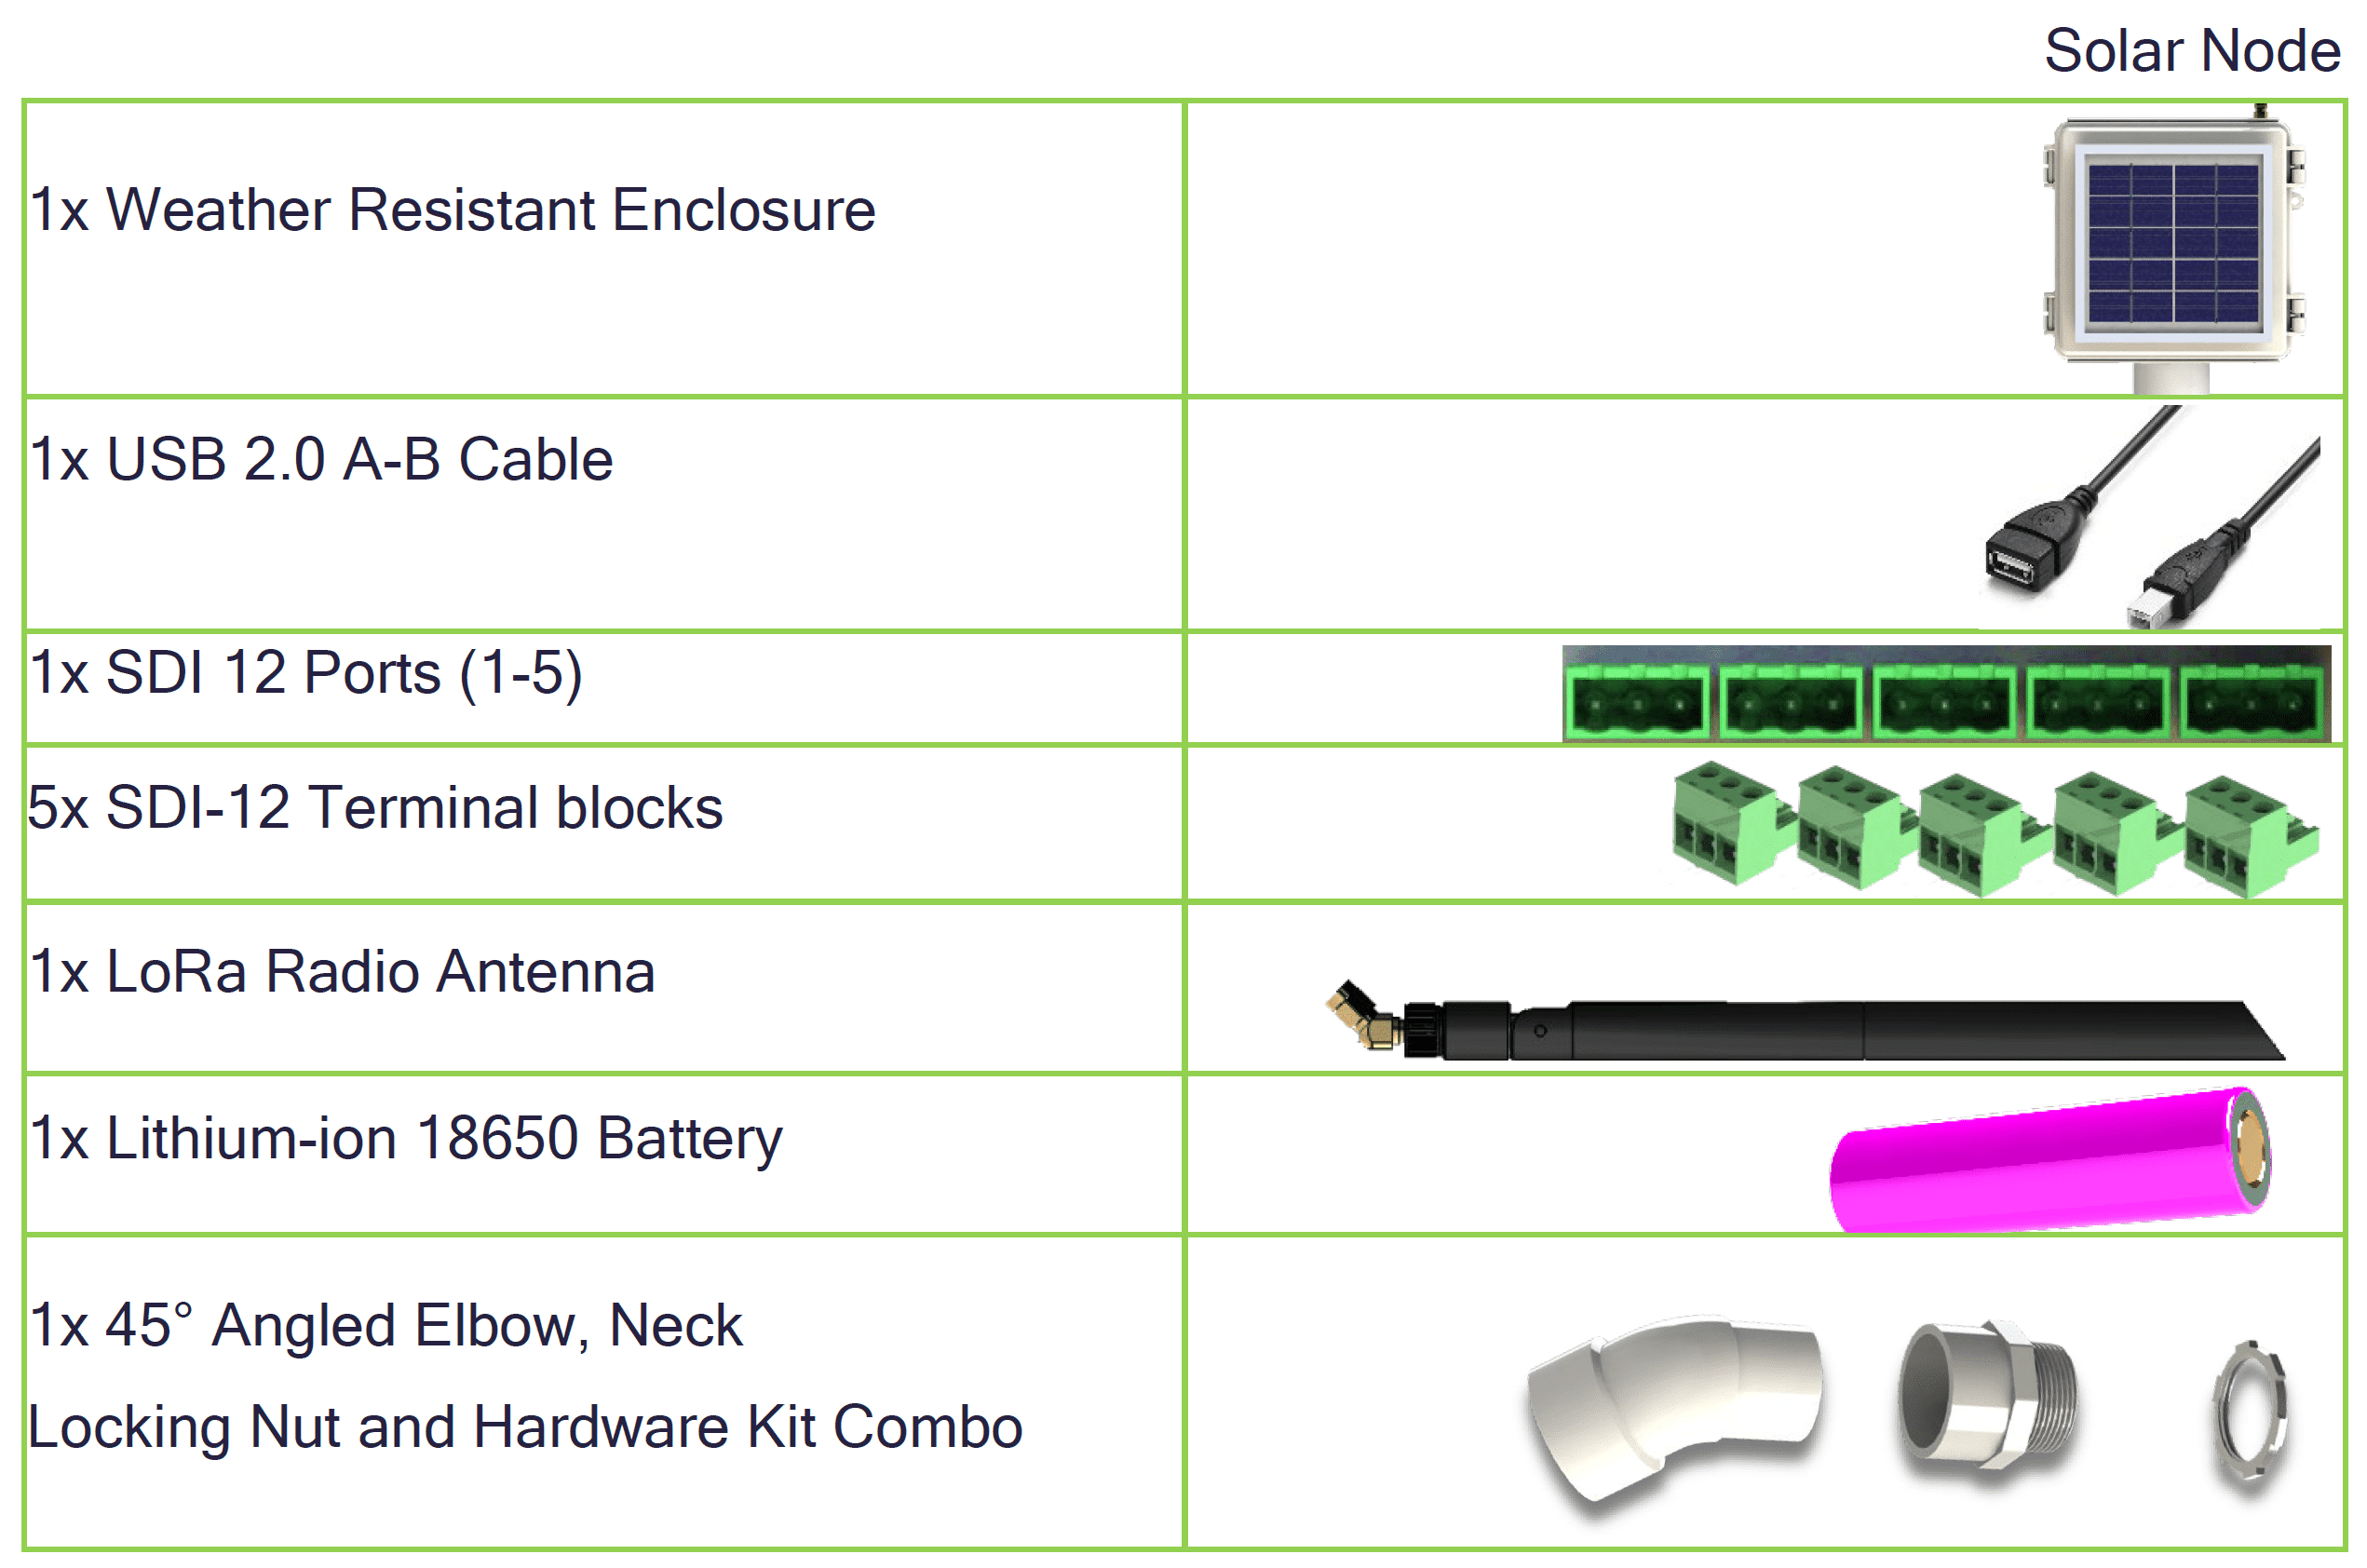
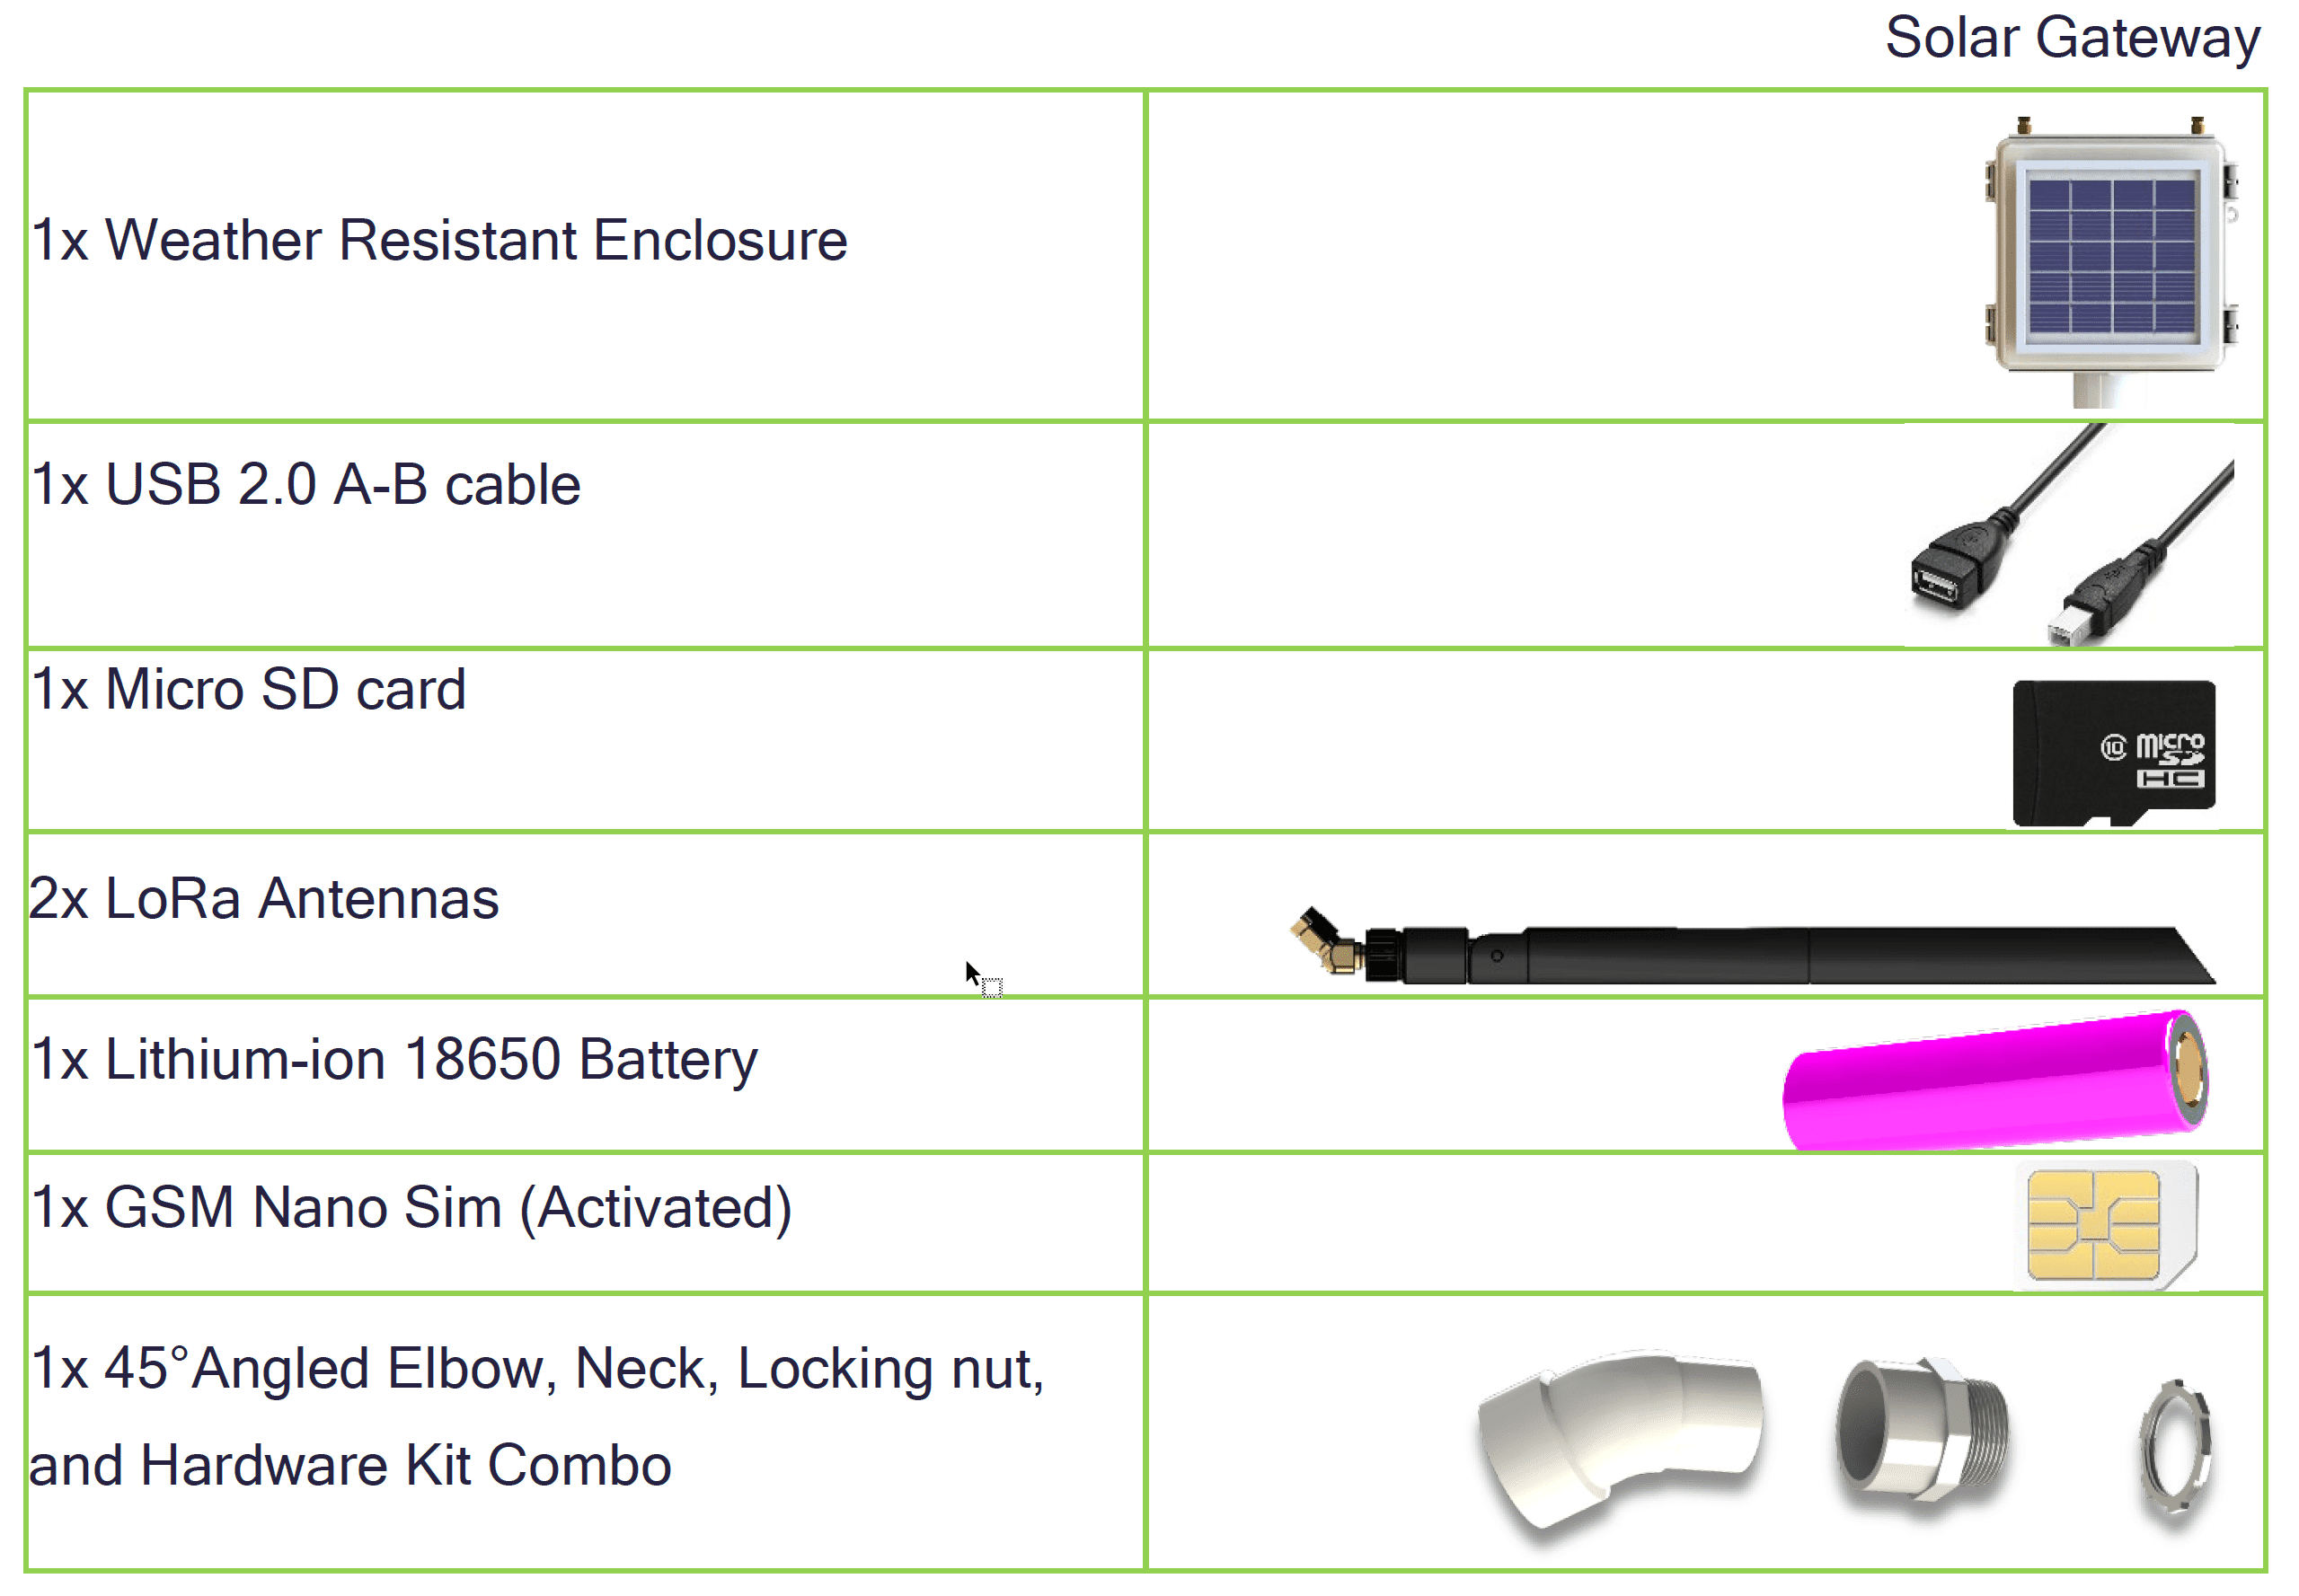
Package Contents
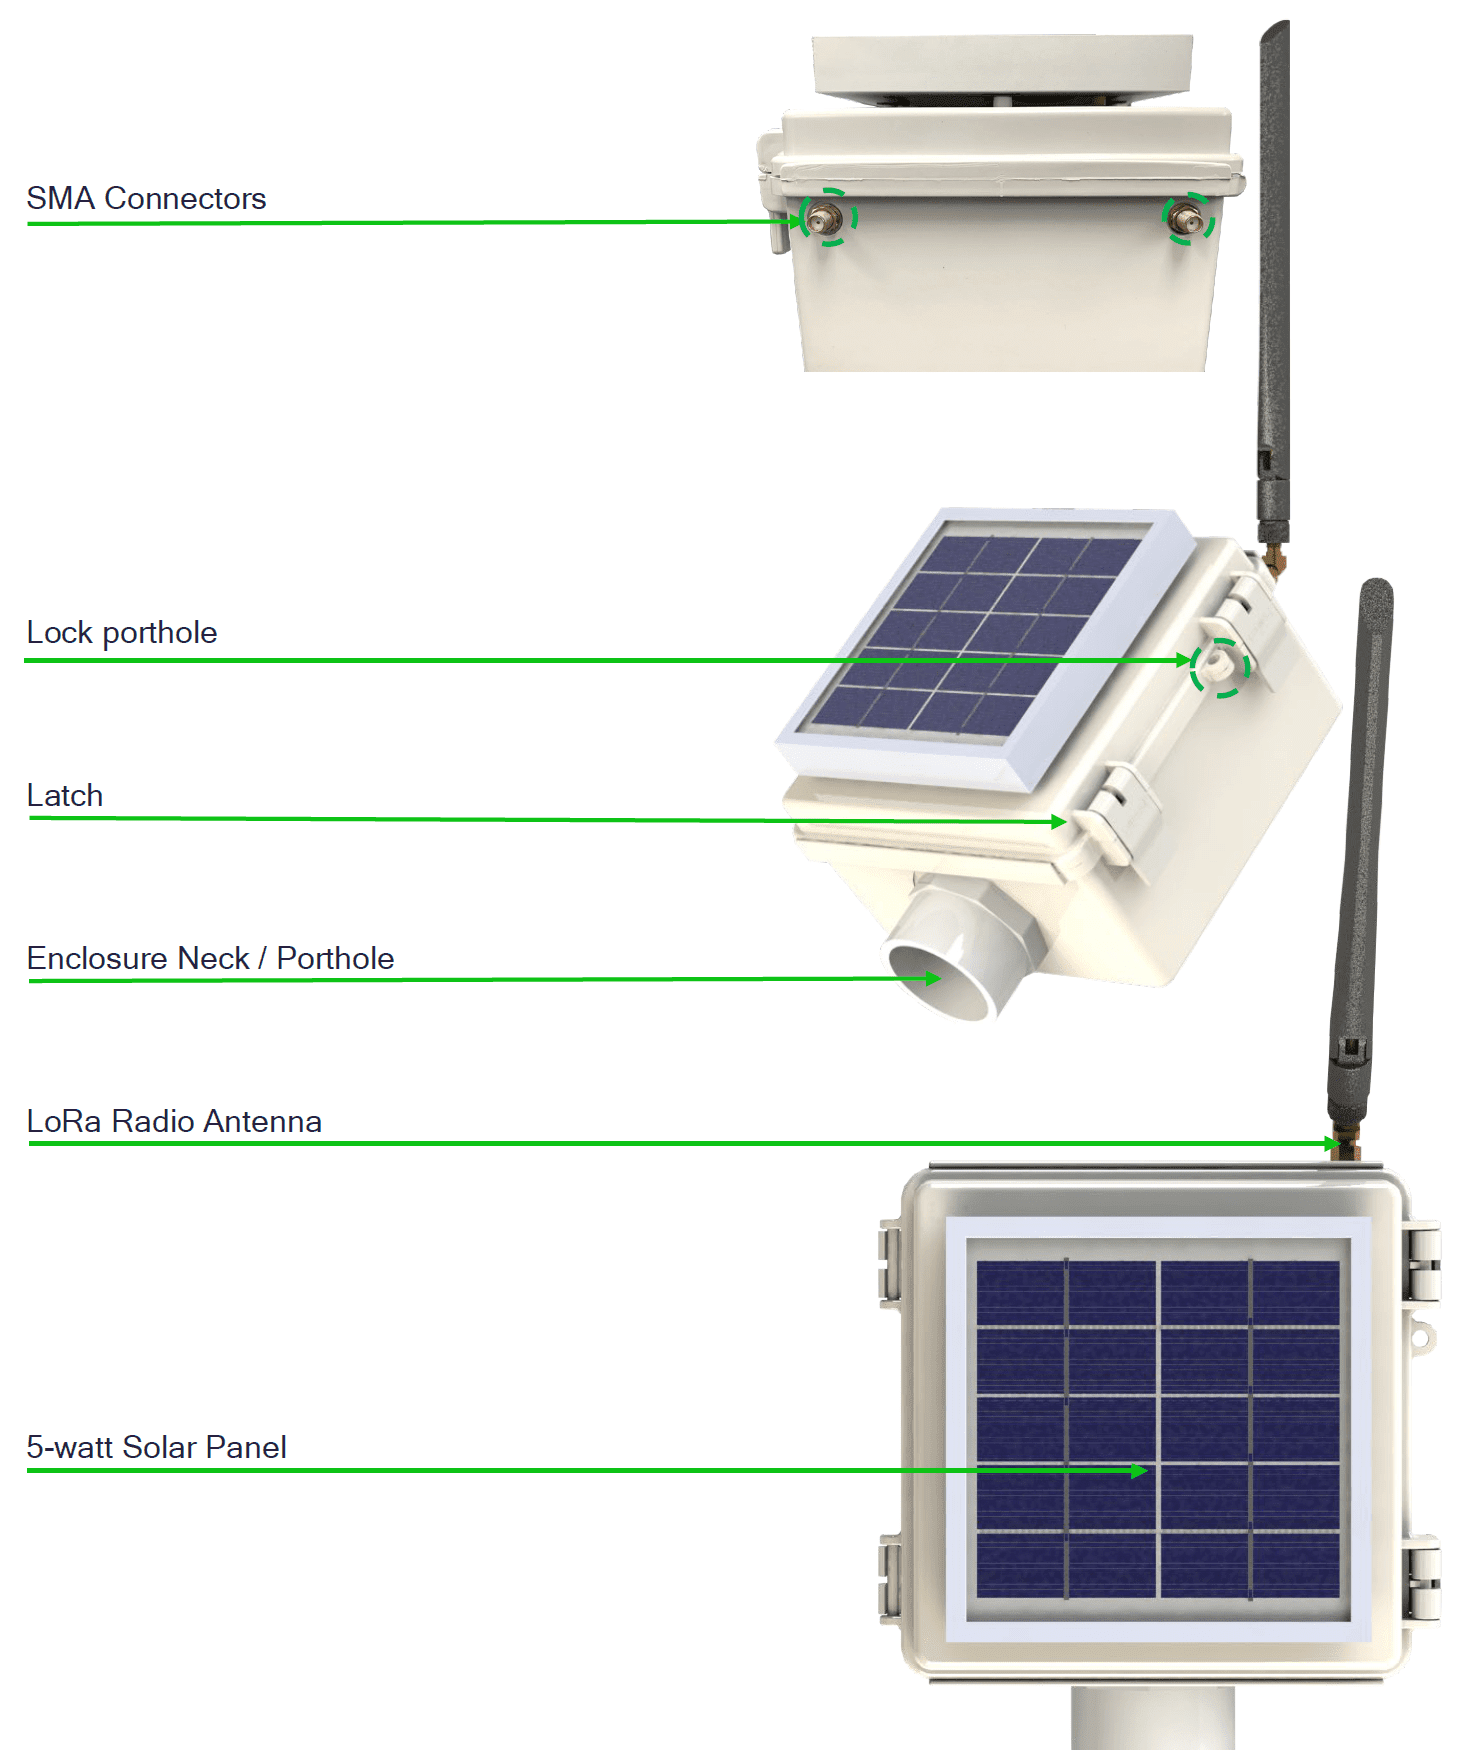
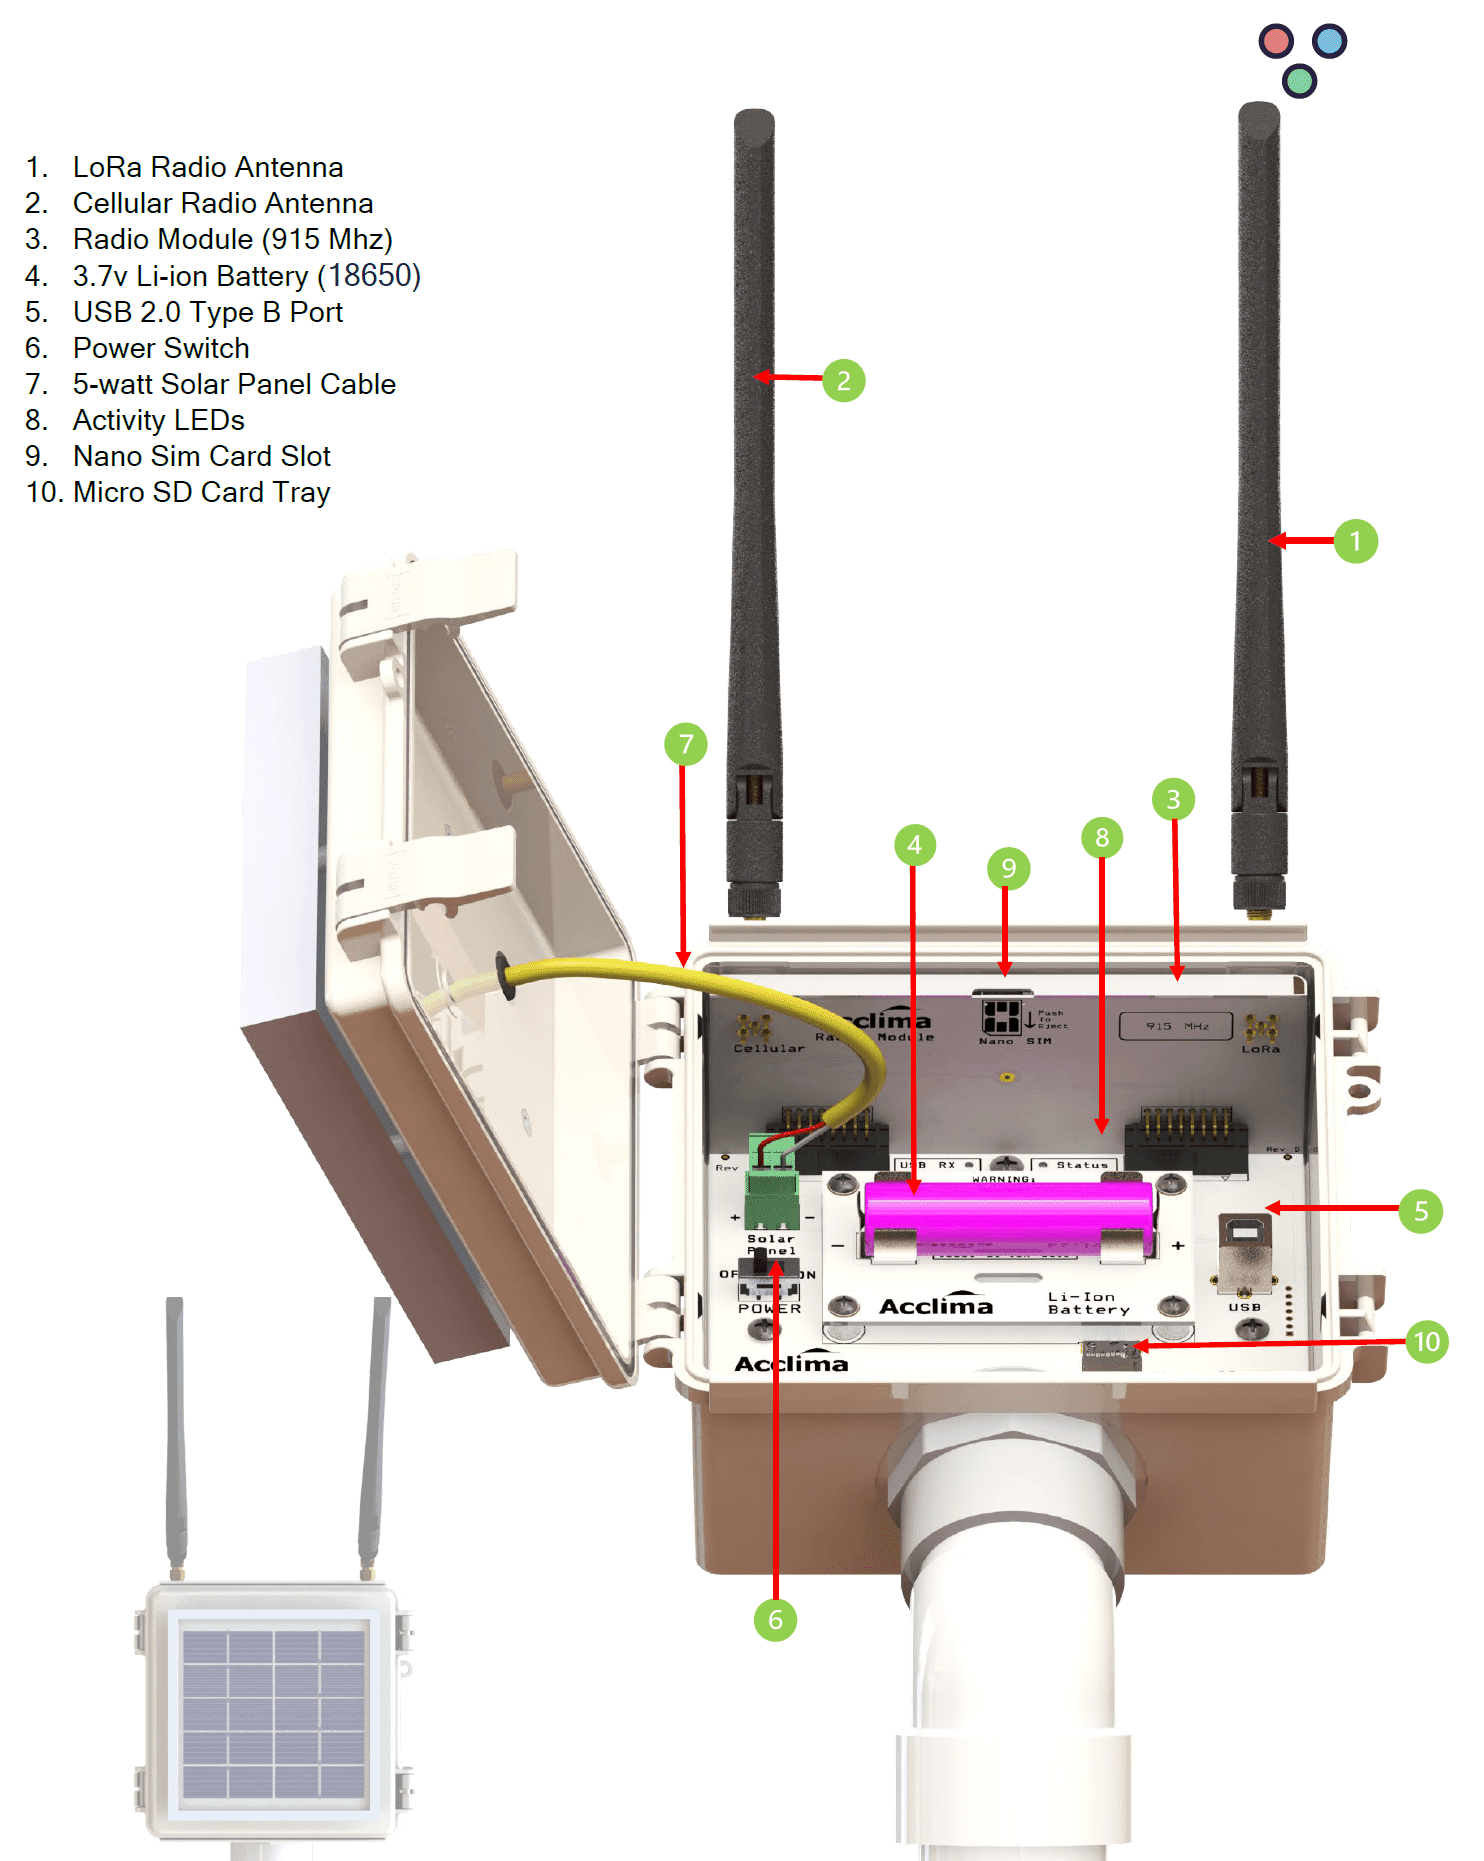
Node and Gateway Exterior Layout
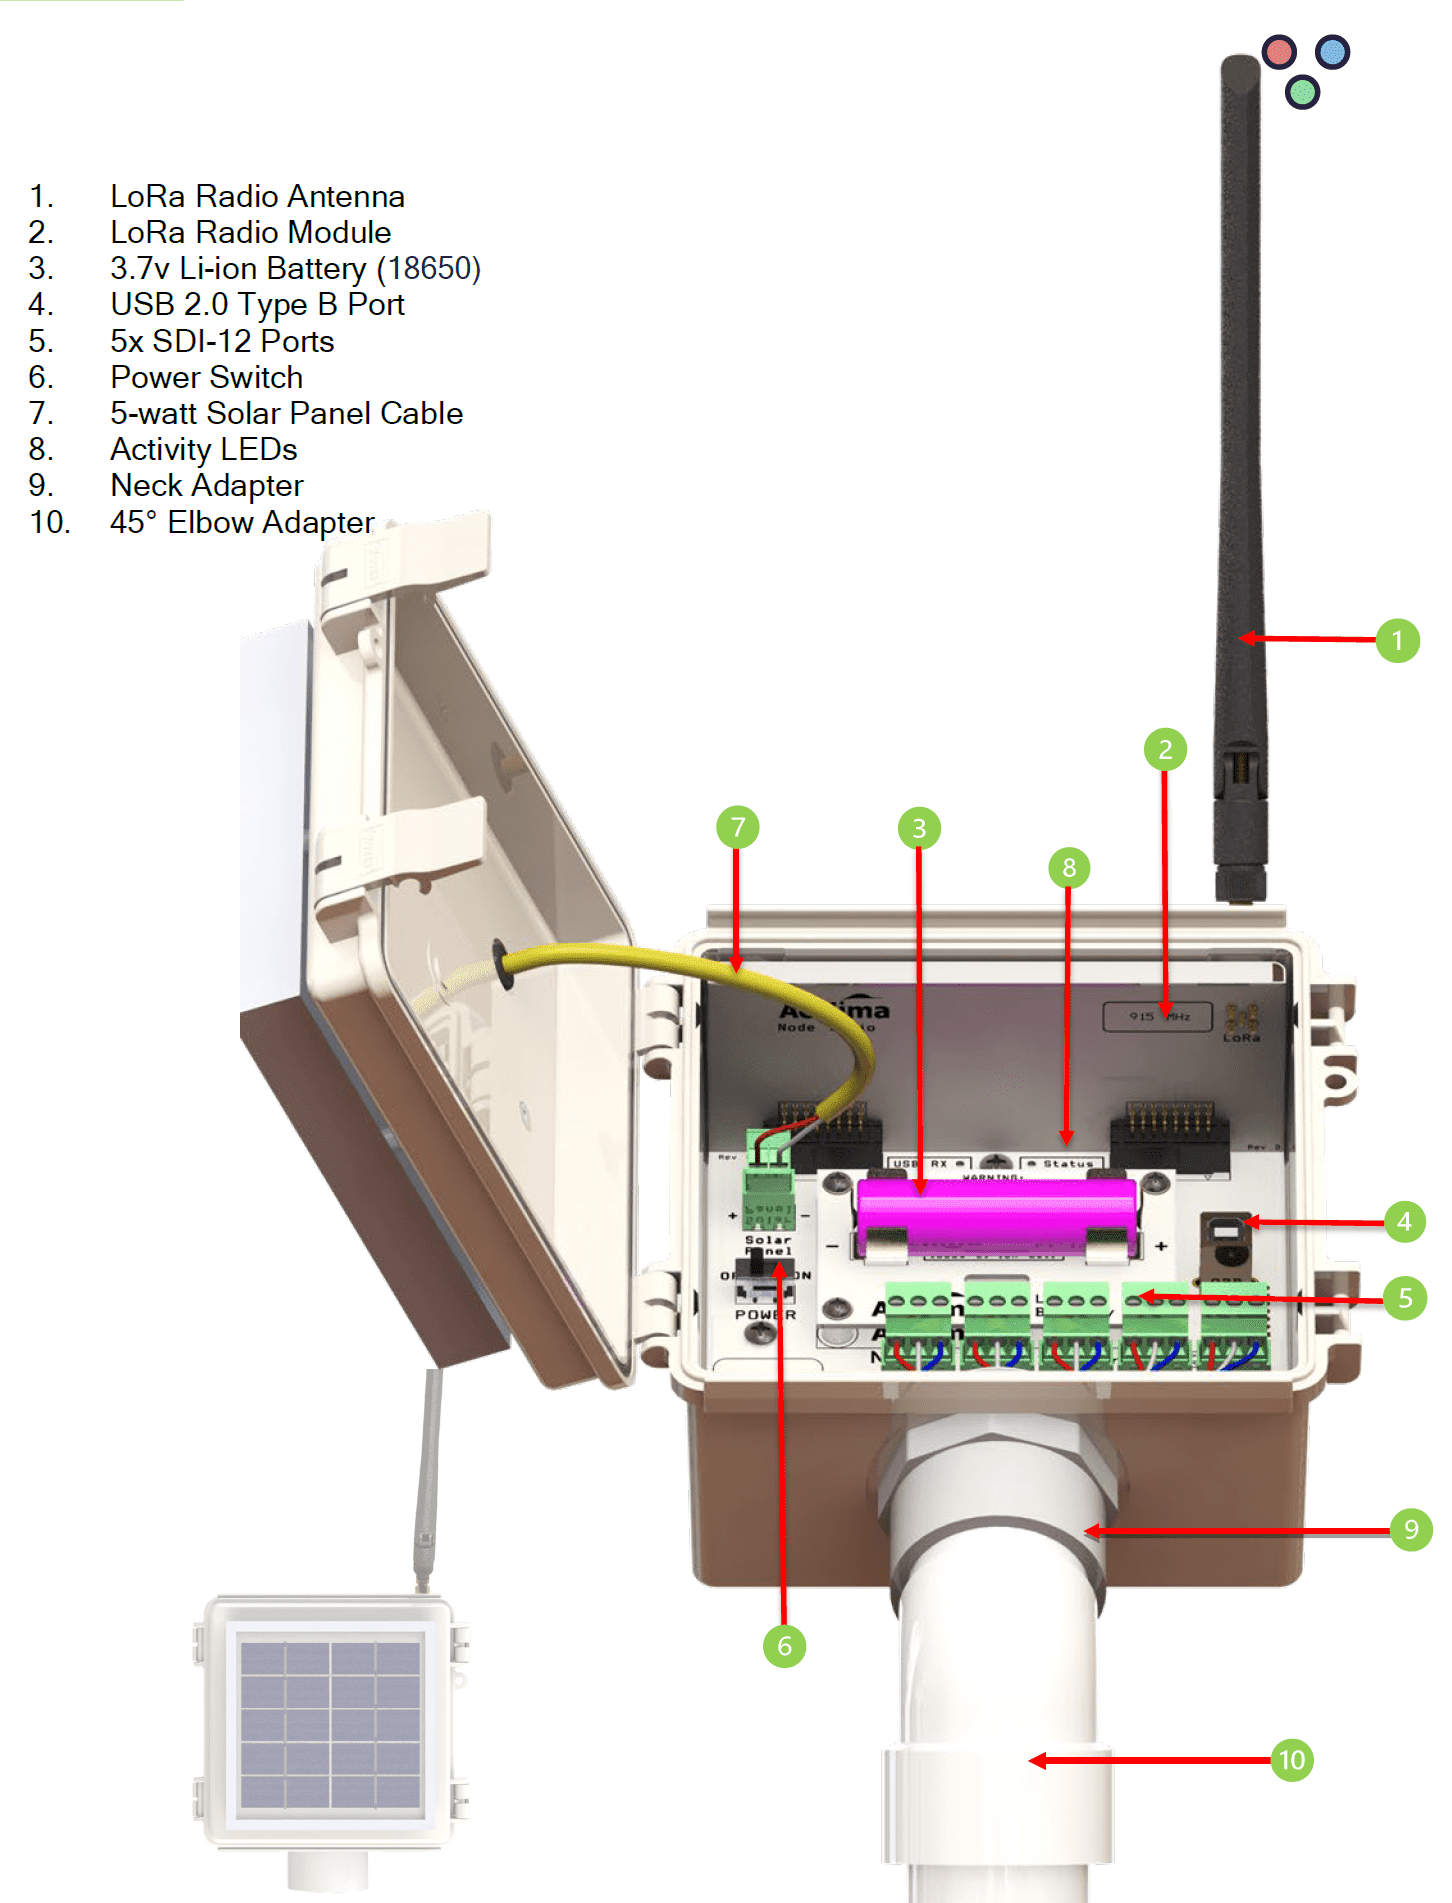
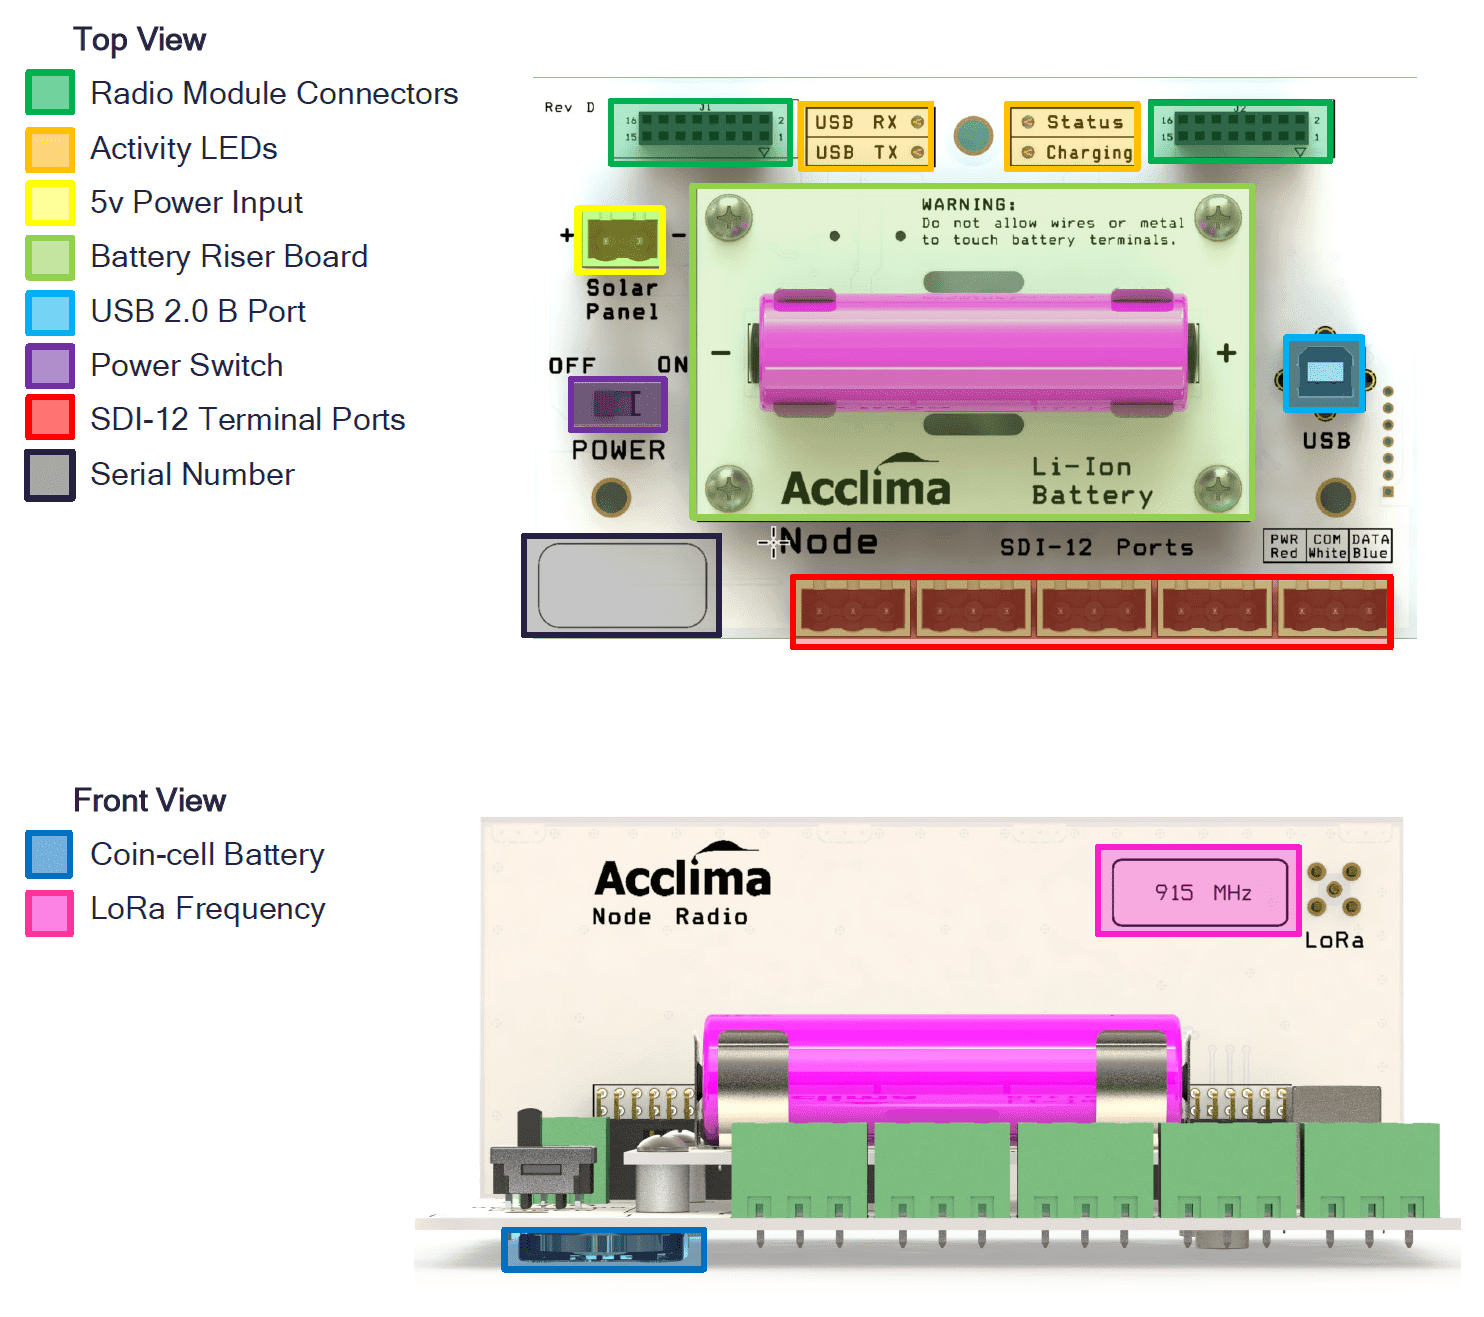
Solar Node Internal Layout
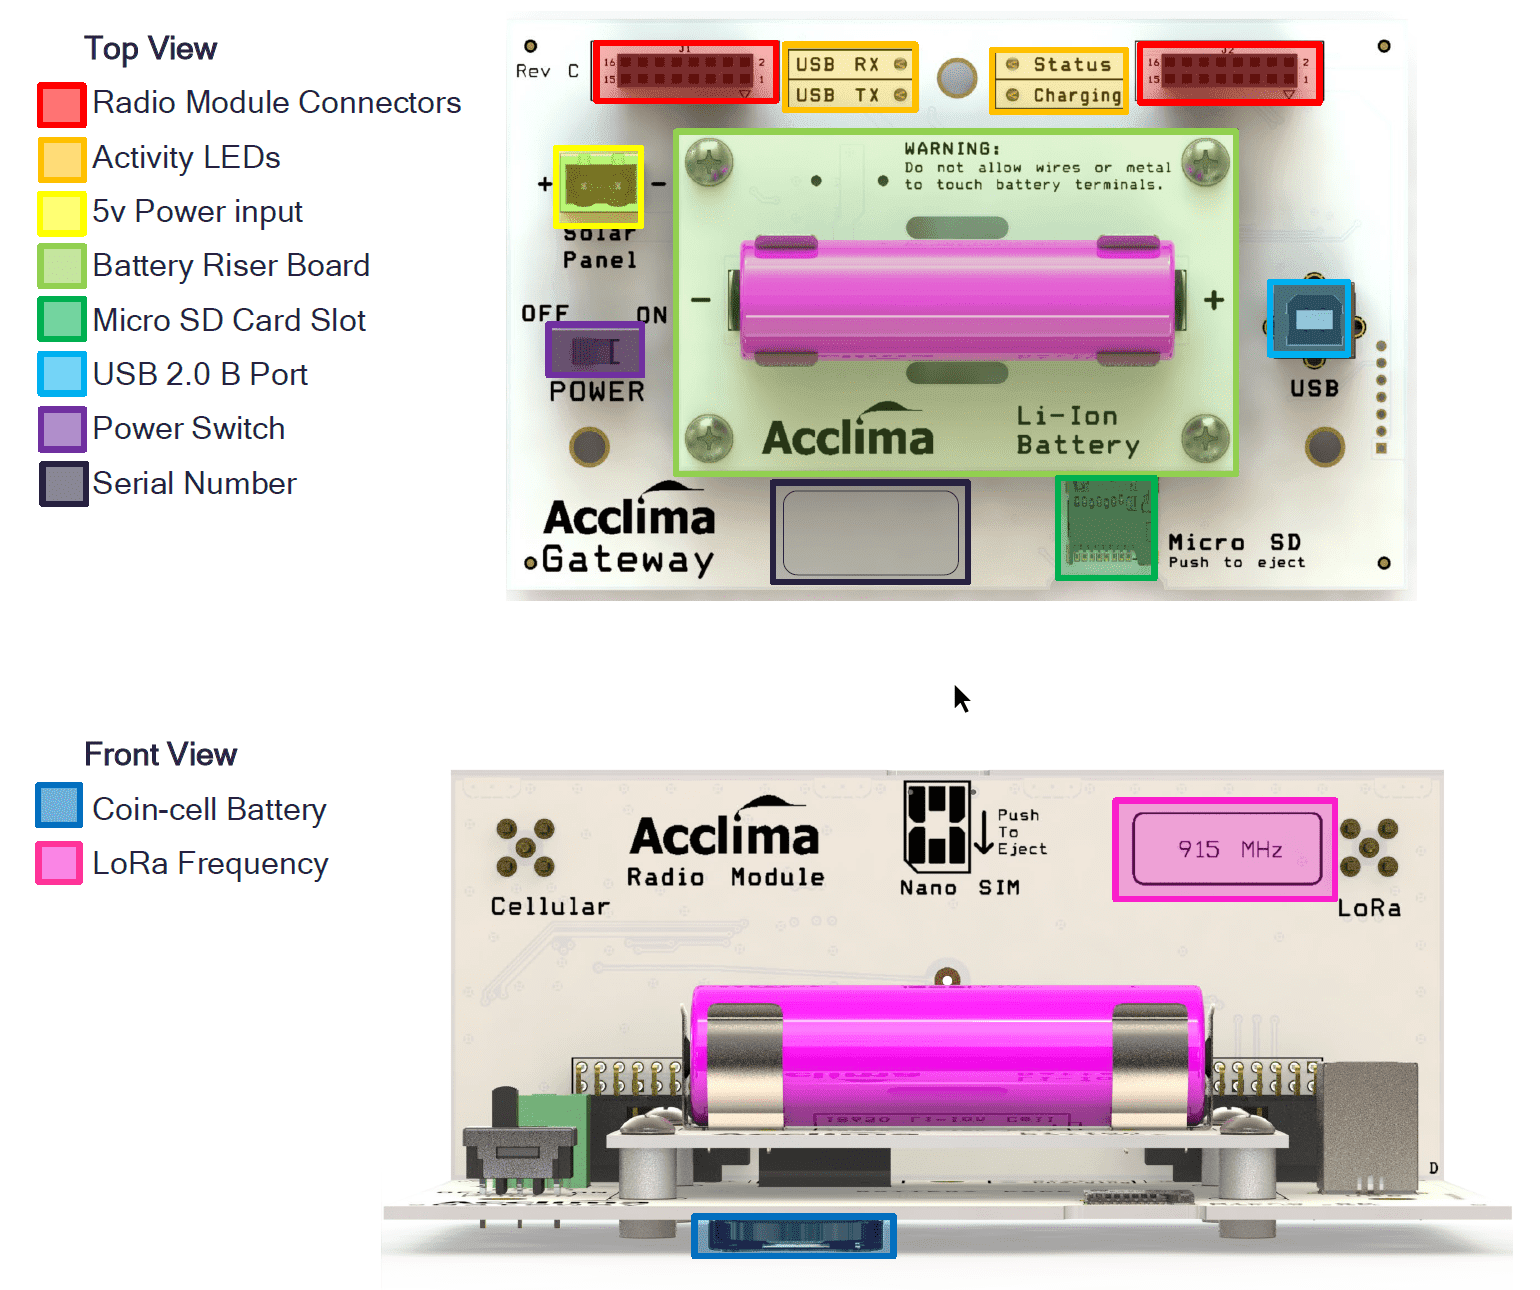
Solar Gateway Internal Layout
Node Motherboard
Each board is coated with a non-conductive silicone gel designed to improve the system’s resistance to humidity.
NOTE: The Solar Nodes are designed to be weather-resistant and are assembled in such a way that makes it difficult to access certain components after assembly in the factory. If there are any issues with the device’s functionality, contact technical support (support@acclima.com) for assistance.
Gateway Motherboard
Each board is coated with a non-conductive silicone gel designed to improve the system’s resistance to humidity.
NOTE: The Solar Gateways are designed to be weather-resistant and are assembled in such a way that makes it difficult to access certain components after assembly in the factory. If there are any issues with the device’s functionality, contact technical support (support@acclima.com) for assistance.
System Functionality
The Acclima Solar Nodes and Gateways are LoRa Radio, SDI-12, data loggers that allow data to be collected and transmitted wirelessly and stored in a secure and private data repository. Each Acclima Node can attach up to ten SDI-12 devices. These devices do not need to be Acclima-specific hardware meaning, any SDI-12 device is supported provided that the total system load does not exceed 5 watts. Each SDI-12 device replies to aM! (Measurement) commands sent from the Node, and the Node records those replies. The user can set the “Read Intervals” to record data from a group of connected sensors from anywhere as low as 10 minutes, to as high as every 24 hours. These measurements are collected and stored in the Acclima Nodes which can save up to 32,000 logs before overwriting the oldest files. Once the log is saved, the Node transmits this data via (LoRa) a long-range radio system within the 902 to 928 MHz frequency bands, at the request of a Solar Gateway. The Acclima Solar Gateway retrieves the data from the Node, saves the files within its memory, and forwards this data to the cloud via an LTE cellular connection. The Gateway’s GPS
coordinates are also forwarded to the cloud within its metadata. Testing has shown that Nodes and Gateways can successfully communicate with one another for more than 10 miles line-of-sight in rural environments. However, the recommended maximum range is 5 miles or less. After the Node data has been uploaded to the cloud, it can be viewed by authorized parties on the secure and private data portal website hosted by Acclima.
Achieving this level of system functionality is both affordable and technically simple. The Solar Node and Gateway system can be acquired and operated by anyone desiring soil and atmospheric data from their personal properties. The system can just as easily be scaled up to provide large entities with the ability to source their data, in ways specific to their needs. Amazingly, in less than one hour, a single person can install one Gateway, three Nodes, and ten sensors.
Gateway Continued
The Acclima Solar Gateway is a solar-powered data repeater that gathers data from up to ten Acclima Solar Nodes – each of which, can accommodate ten sensors – and transmits the data to the cloud via GSM Cellular Network.
The Gateway utilizes two radios: a LoRa Transceiver for communications with the Nodes and a Cellular Modem for communicating with the cellular network. The Gateway initiates communications every 30 minutes, it scans its list of affiliated Nodes and gathers data from them in quick succession and it writes the received logs to its memory. With each communication cycle, it also sends timing information that the Nodes use to synchronize themselves for the next data-gathering cycle. After the data from the Nodes are gathered, they are transmitted to our cloud repository on the where they are stored, analyzed, and formatted for easy access and interpretation by the user. The user accesses the data through an Acclima portal using their username and password. Data from up to one hundred sensors are accessible through a low-cost user subscription.
Data transmission between the Nodes and the Gateway has been confirmed at a 10-mile line-of-sight using the Long-Range Mode. Five-mile line of sight communications is practical using standard settings. These ‘comfortable’ settings give a considerable margin to increase power and drop bandwidth if the 5-mile link is somewhat marginal. The typical distance for tree-cluttered and building-blocked communications is one mile. Gateway to cloud communications works wherever GSM cell phone service operates.
Gateway Cellular Service/Acclima Cloud Data
Acclima Solar Gateways are equipped at the factory with a pre-installed nano sim card utilizing Hyper SIM technology. The Gateway can forward data to the cloud anywhere in the United States that has a minimum of 2G GSM cell tower coverage. This technology allows activated Solar Gateways to connect to the internet while having redundant access to the cloud thanks to its automatic outage detection capability. These features allow the Gateway to hop between multiple carrier networks that are providing GSM coverage overlap in the area. The Gateway supports multiple carrier signals like 2G, CAT-M1, and LTE.
NOTE: The Acclima Cloud service is activated without contracts and is pre-paid on an annual basis. Contact your distributor for pricing and renewal information.
Before Installing
Before field installation of the Node and Gateway System, it is important to be aware of some key points. These topics below will be revisited throughout the document.
- Sensors
- Media
- Site Prep
- Burial depth
- Batteries
- Solar Power
- Line of sight
Sensors
Acclima has been developing soil-moisture sensor technology for over 20 years and has gained a wealth of information regarding soil-moisture sensor technology. There is a wide range of SDI-12 devices on the market and each has different methods of capturing data points. Due to this, the end user must make all arrangements to understand the sensor technologies they will be implementing with Acclima’s Solar Node and Gateway system. Please source manufacturer documents about the sensors you plan to use with the system, to ensure that the readings you are viewing are correctly labeled and formatted. However, if you choose to mix and match different sensors, please take the time to study the characteristics of each type and ensure that the data from each is formatted correctly.
Media
Soils and their varying properties will prove to be a difficult challenge to understand and overcome. It is important to learn the characteristics of the media in which you plan to install your sensors before their installation. Notate and record the serial number, soil type, GPS coordinates and burial depth for each sensor and Node at the location of its installation.
Site Prep
When considering the installation zone, select an area that allows for good cellular reception, line-of-sight between devices, and SDI-12 device proximity to Solar Nodes is within 200 feet.
Burial Depth for the Support Mast
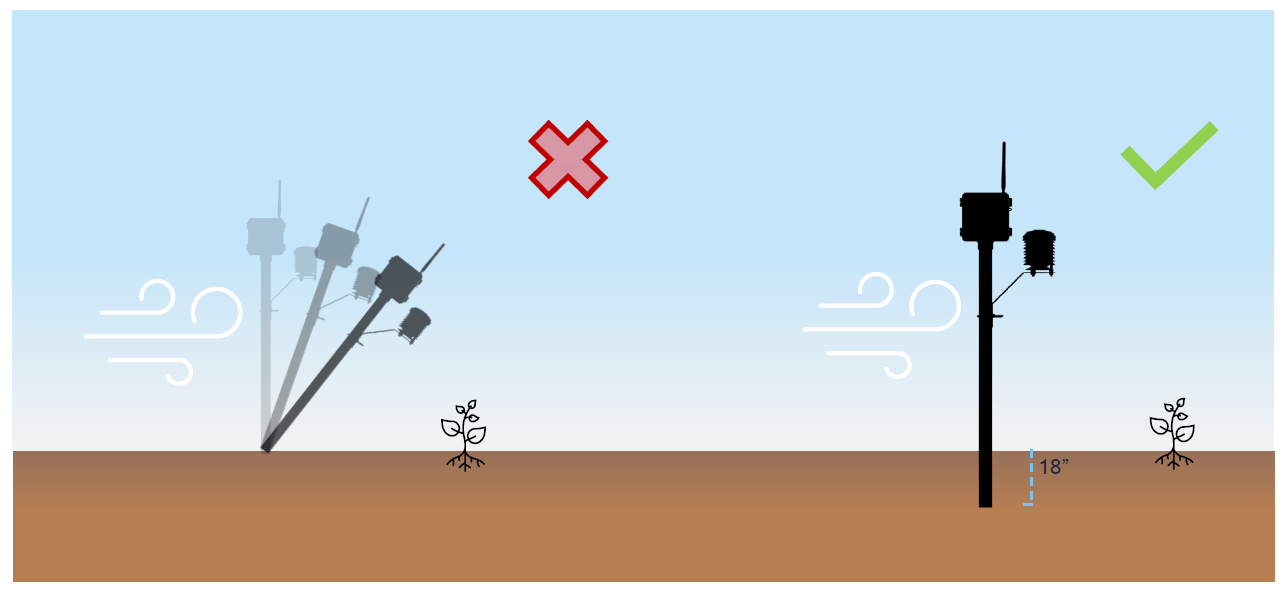
Weather patterns in your local area should be a big part of the decision process when installing the Node and Gateway system. If your area is prone to flooding or high winds, take appropriate steps to mitigate the need for maintenance by burying the PVC pipes (posts/conduits/masts) deeper into the soil.
Acclima recommends using a 2 ½ meter tall Schedule 40 furniture PVC post and burying it between 18” – 24” deep. In most cases, these depths provide the strength to keep the Nodes and Gateway upright during winds as high as 40 mph.
Batteries
The Solar Node and Gateway are powered by a 3.7v Lithium-ion battery that is recharged by solar energy. With access to sunlight and favorable climate conditions, the included battery can live for years without needing replacement. Although the technologies in lithium-ion cells are fantastic, the technology is not without its drawbacks. Like humans, Lithium batteries do not like temperatures too hot or too cold. In the case of the batteries, too hot is anything over 45°C too cold is under 0°C. Lithium batteries can survive these temperatures for brief periods, but prolonged exposure to extreme temperatures will reduce their life span.
Solar Power
When preparing for installation, it is key to pick the best spot for the Solar Node and Gateway to get the most sunlight throughout the year. The Gateway should have an unobstructed view of the daytime sky. Try to avoid facing mountain ranges or buildings that the sun can dip behind for long hours in the winter months. Reduced sunlight will reduce the solar current, therefore, reducing the speed the battery is replenished.
Line-of-Sight
Achieving proper line-of-sight between the Nodes and Gateways may be the most difficult problem to overcome when installing in the field. To simplify the methodology, try to imagine your LoRa antenna as a flashlight. The fewer the objects the beam of light must scatter around, the greater the opportunity for the target to view the light being shined on it. Ideally, you want little to no obstructions between the Node and Gateway, just like you would not want any trees between your flashlight and whatever you wanted to illuminate.
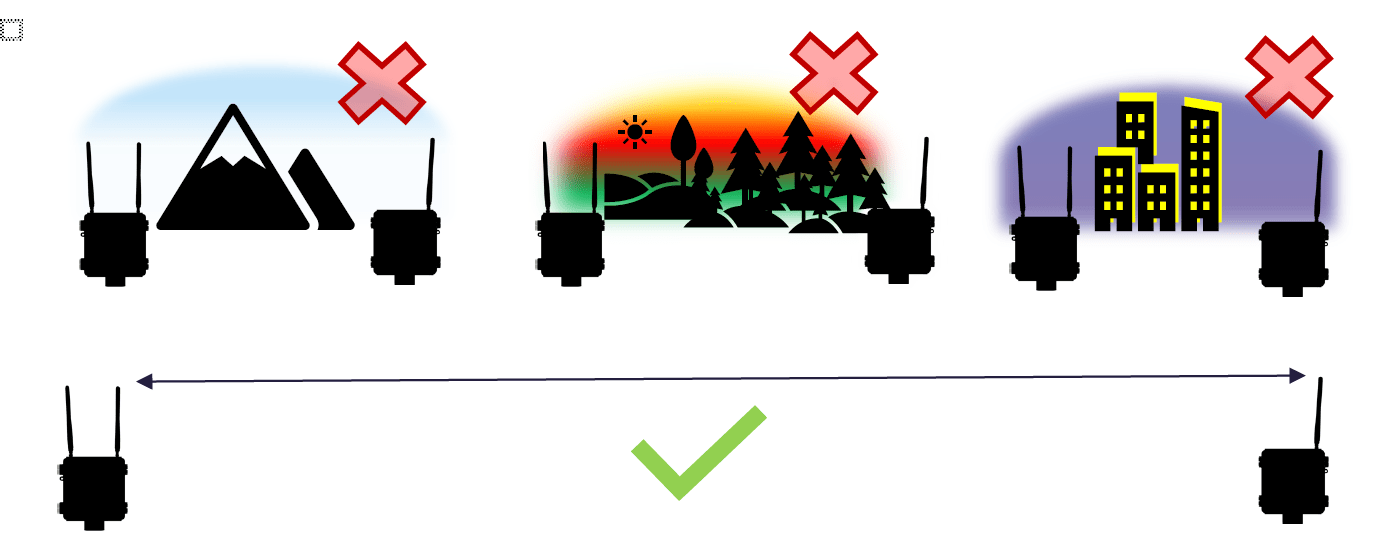
At distances greater than 1 mile minimize the obstructing objects between the LoRa antenna.
Hardware Details
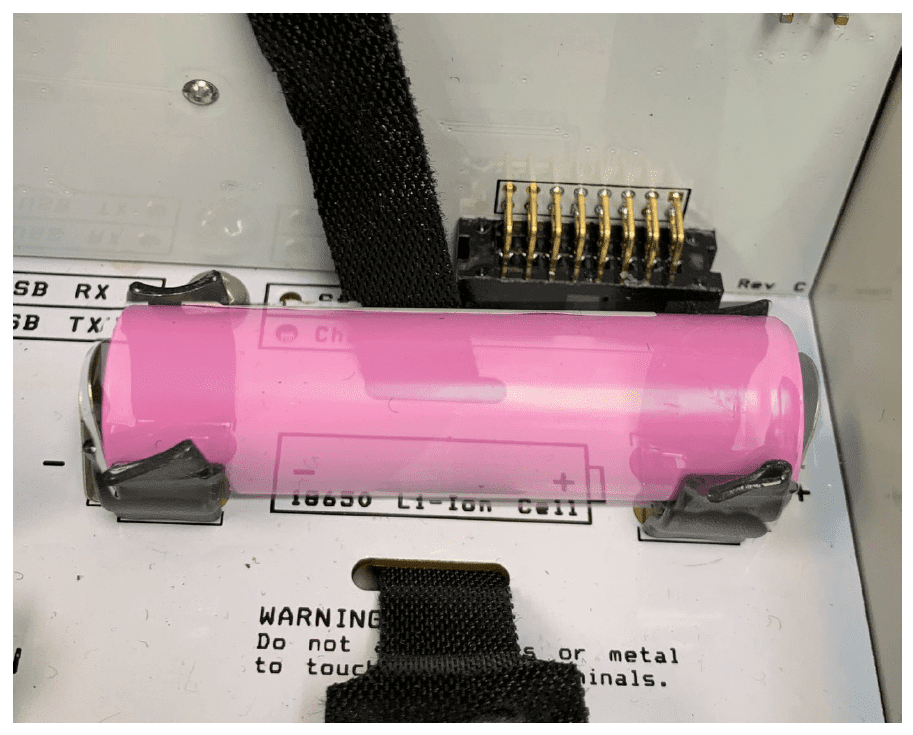
Battery
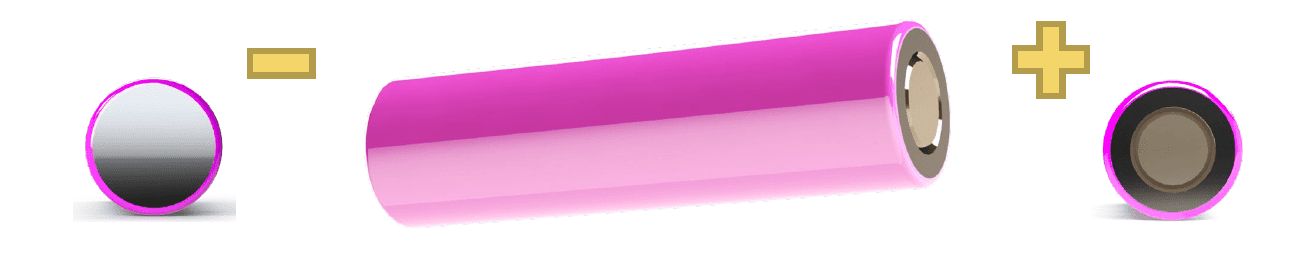
The included battery will be pre-installed and secured by a Velcro strap. The Lithium-ion battery will be unlabeled, with no visible (+) positive or (-) negative symbols. Therefore, if it is removed you must identify the positive and negative parts of the battery to seat it correctly into either a Node or a Gateway.
i. Flat side is Negative (-) raised button side is Positive (+)
ii. Use the included Velcro strap to secure the battery into the battery terminals.
CAUTION: Do not allow wires or metal to touch battery terminals!
NOTE: Protective insulators were added to the battery cradle to prevent accidental shorting from tools and other metallic objects dropped into the housing. Do not remove the insulators from the battery cradle. If there is damage to the pink outer layer of the battery, replace the battery.
Battery Life
Energy for the Node and all attached sensors is stored in an 18650 Li-ion battery with a 3.0 Amp-hour capacity. The self-discharge rate of the battery is less than 2% per month in worst-case summer weather. The battery is charged by a 5-watt solar panel at the rate of 400 mA in full sunlight. The time to fully charge the battery is 7.5 hours in full direct sunlight of at least 800 Watts per square meter intensity.
The battery capacity is sufficient for operating the Node and attached sensors during the night and long periods of darkness. Figure 1 below shows the number of days the Node will operate before the battery runs down in total darkness. It includes the battery self-discharge current, the Node operating, and communications current, and the current drawn by up to 10 sensors.
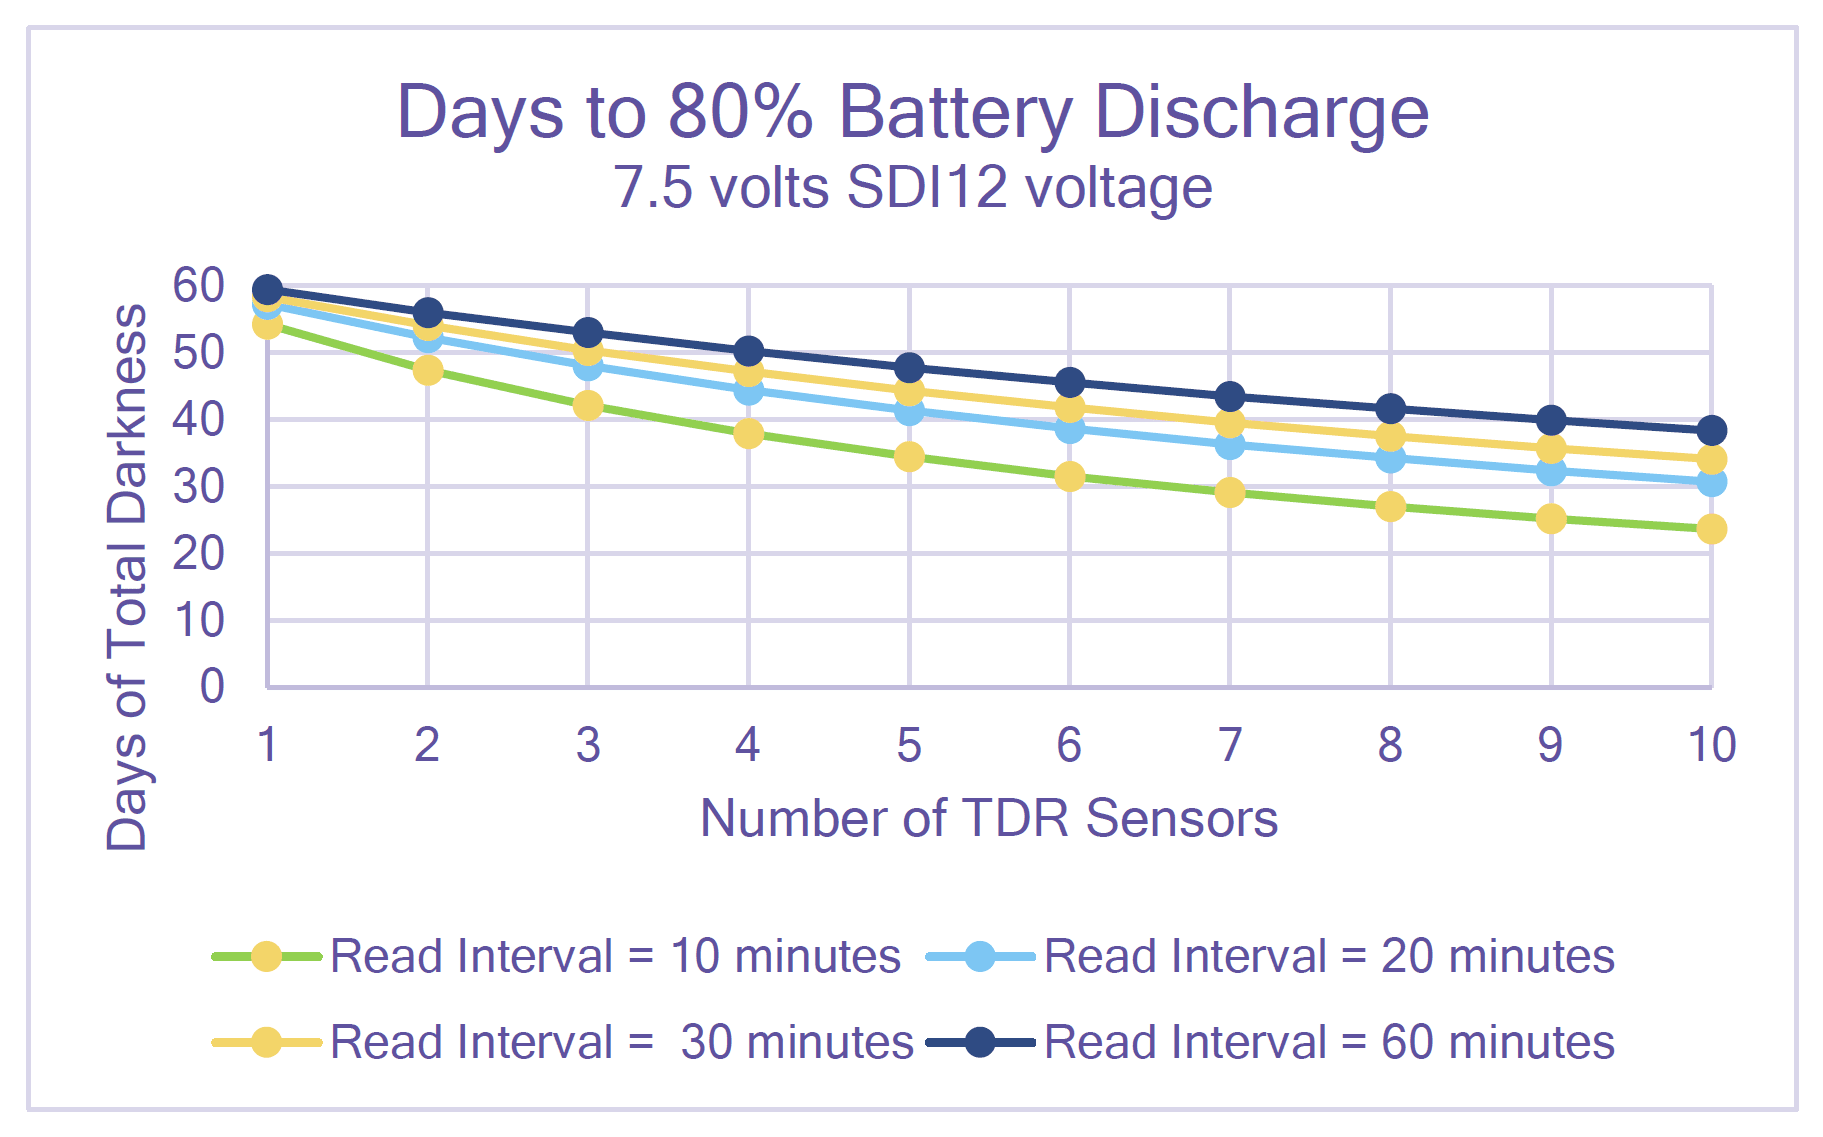
Figure 1 was derived using the 7.5-volt option for the SDI12 voltage, but the 12-volt option shows very similar results.
Figure 1. Battery Discharge Time (days) when no sunlight is available to recharge the battery.
NOTE: Battery life is estimated based on internal tests using manufacturer-specified conditions. These estimates are used as a baseline for approximating the theoretical battery life expectations for most users.
Important Note:
The key takeaway from this information should be that when the sensor load increases, the requirement for ample sunlight also increases. High load configurations should provide the Solar Node with ample opportunity to receive maximum solar current or face the risk of the battery becoming ‘depleted’. The battery management system will disconnect the battery from the Node or Gateway when it becomes discharged to the point where further current drain would damage the battery.
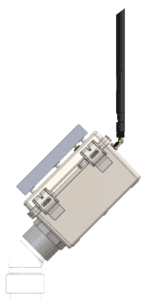
Solar Panel Orientation
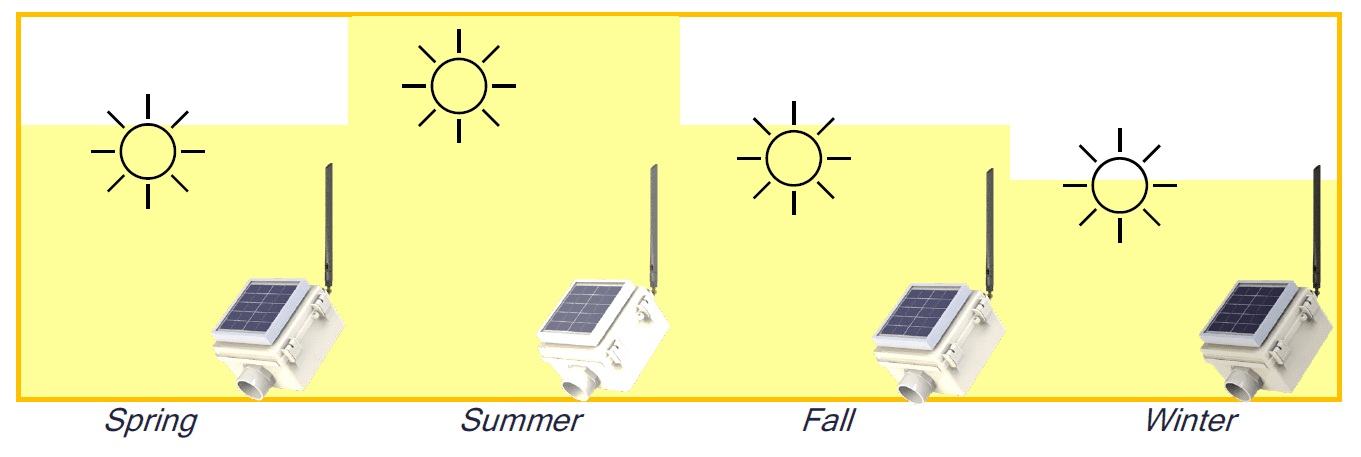
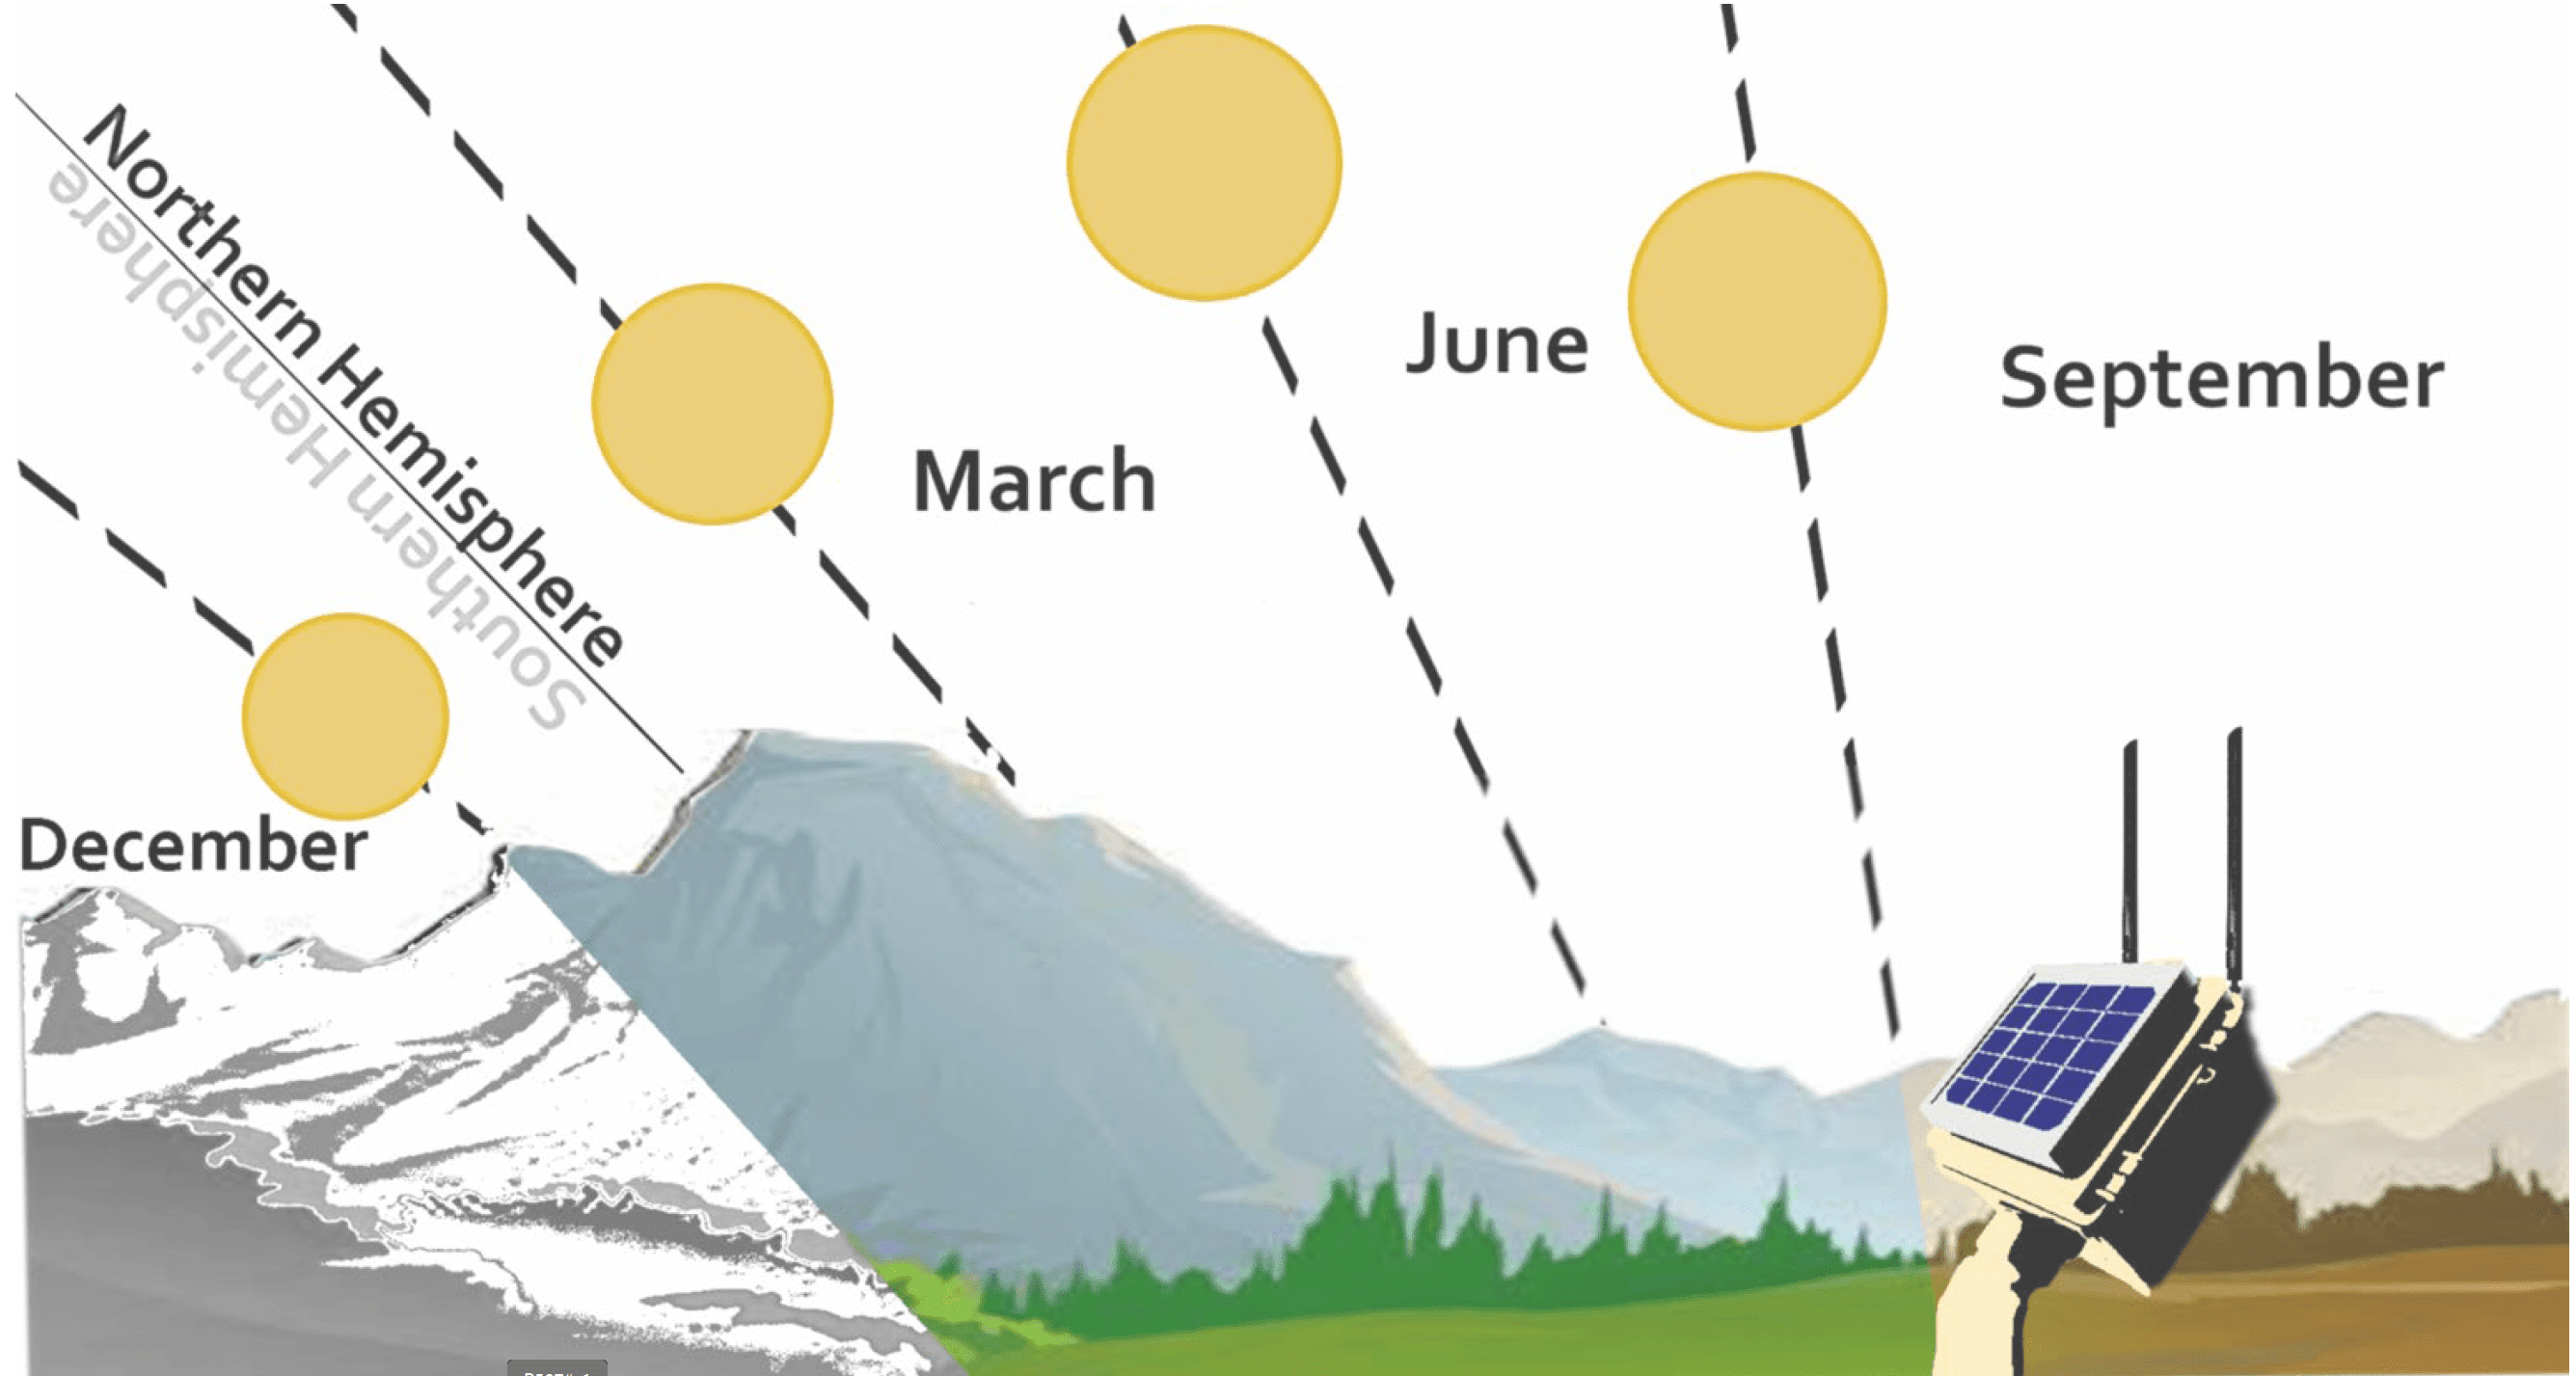
For proper operation of the Solar Node and Gateway hardware, it cannot be overstated that the solar panels need to have as much access to sunlight as possible. The best way to achieve this is by orienting the panel at 45° towards the southern sky if you are installing in the Northern Hemisphere and vice versa for the South.
As you are already aware, Earth is a globe with a 23° tilt, that rotates on its axis and revolves around the sun. Throughout the year different parts of the globe will receive greater or fewer sunlight rays depending on the time of year. During these seasonal changes the angle at which the sun appears overhead during noontime shifts. Which will cast shadows differently during the year’s equinox and solstice periods. Keeping these shifts in mind can help predict whether an installation site will be free from shadows all year round.
We recommend choosing an installation that accounts for the shifting positions of the sun throughout the year. This is best done by choosing an installation location clear of any trees, nearby buildings, or mountains, and then angling the Solar Panel 45° toward the Southern sky when in the Northern Hemisphere. If this is done correctly, the Sun’s arc will always rise and travel over the width of the solar panel for the greatest number of hours possible per day.
NOTE: If the Node and Gateway devices are installed incorrectly or nudged out of alignment, the neck adapter allows the installer to manually twist the enclosure back to a better orientation.
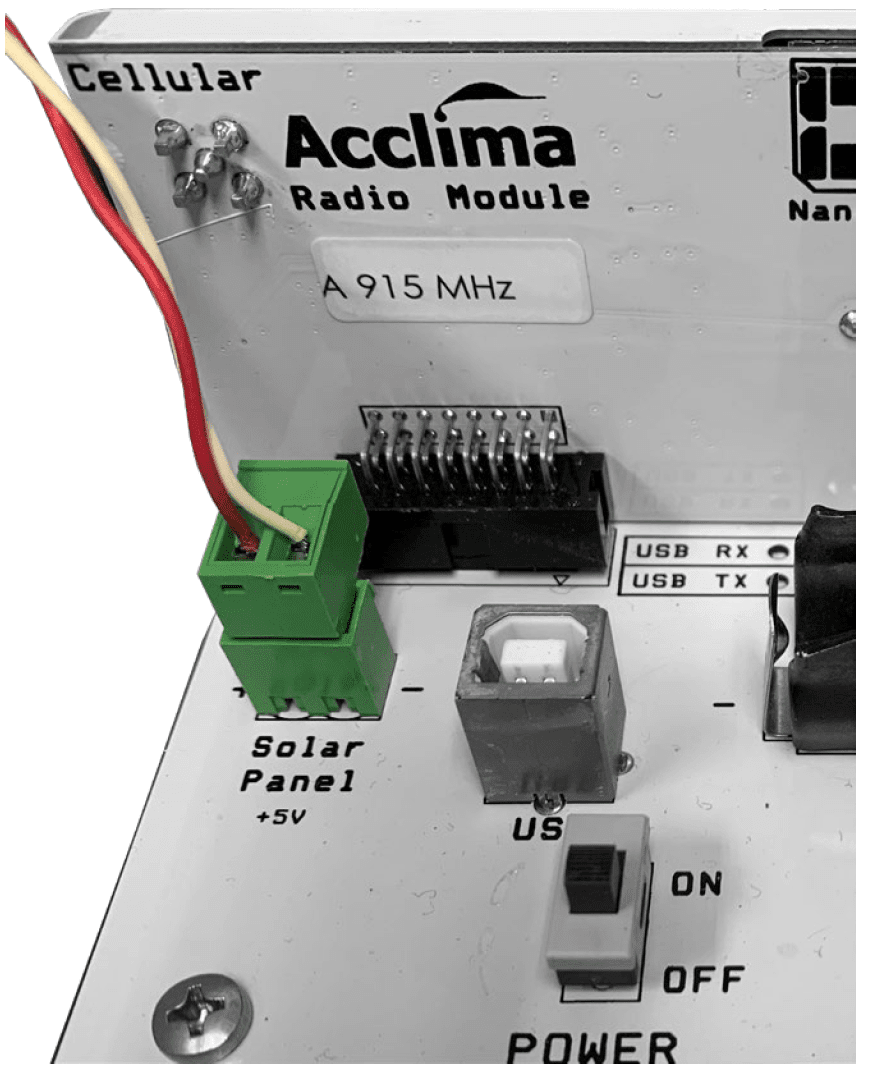
Solar Current
The included 3.7v Lithium-ion battery is recharged each day by a 5-watt Solar Panel. The battery recharge state occurs when the enclosure temperature is less than 45°C and greater than 0°C, and the Battery voltage is less than 4.2 volts. The Solar Node and Gateway require a minimum of 3.6 volts from the battery, to operate according to specification. Below this threshold, the Node will cease communication with Gateway, and Gateway will cease transmission to cellular networks. In a typical day and night cycles, the solar panels will provide ample voltage to resupply the battery and provide proper power to the system.
The battery voltage and available solar charging current are both monitored and reported by the Nodes and Gateway. These data points are available on the data portal and on demand via USB export to a PC using NodeView™. Allowing the user to assess the condition of the overall Node/Gateway power system.
Potential trouble with Solar Current
Temperature: As discussed previously, the Solar Node and Gateways are designed to operate on their own in harsh conditions and hard-to-reach areas. However, they are not immune to the environment if there is a heat wave or cold snap that lasts longer than 2-3 weeks. Paying close attention to the status of the systems may be an important measure to prevent data loss.
In the case of extreme heat, where ambient temperatures reach above 50°C, the internal enclosure temperature may reach levels much higher! These higher temperatures take longer to cool off while enclosed inside the Node and Gateway. Even when temperatures outside have reduced to reasonable levels, temperatures inside the Node or Gateway may remain too hot to recharge the battery. The time where this may be the case can extend for many hours past sunset. During freezing and sub-zero conditions, temperatures may not climb high enough in the enclosure to start the charging circuit even, when in direct sunlight. Many days of operating under these conditions will deplete the battery and decrease the functionality of the system, and manual intervention may be needed to recharge the batteries.
Avoiding the Shade: Overcast days, aren’t enough to prevent the solar panels from getting sunlight. Solar radiation can still penetrate through some clouds and allow enough energy to reach the solar panel cells. Making sure that the panels are angled 45° toward a clear sky has the most impact on solar panel performance. This allows the most rays to strike the panels even when they are not facing directly at the source. The panel performance is most negatively impacted by objects that cast shadows onto the panels. So be mindful of nearby trees, and their potential to change throughout the year. Also, buildings under construction can have an impact post-installation. We recommend that the Solar Node and Solar Gateway be installed in a location far from trees and other large obstacles that might cast shadows directly onto the solar panels.
Debris from birds and animals: If the reported solar charging current appears to be abnormally low, it may be necessary to clean debris from the panel.
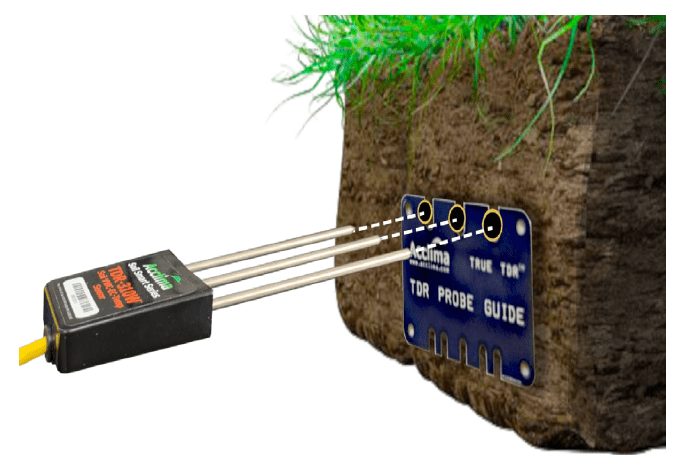
SDI-12 Ports
SDI-12 is the name of the communications protocol that the sensor uses to communicate with the logger. SDI-12 employs a bidirectional serial data line to communicate between the sensors and an SDI-12 recorder. The maximum wire length between any sensor and recorder is limited to 200 feet. The Acclima Solar Node supports up to ten SDI-12 devices.
The Node comes with five SDI-12 connectors which will allow for dual wire splicing of two sensors per connector. When the data recorder needs a sensor reading, it transmits the command [aM!] to the address of a specific sensor. All the sensors will hear the request for the sensor data, but only the sensor with a matching address will respond. All Acclima SDI-12 sensors are shipped from the factory with the default address of ‘0’. If two or more sensors are connected before the default address has been changed to a usable address, the sensors will not read, and failures will occur. Follow the steps on page (45) to ensure that all sensors are addressed properly.
NOTE: The SDI-12 port can provide up to 5 watts of power. Shared among up to ten connected SDI-12 devices.
Line-of-Sight/Range
Acclima has gone to great effort to ensure the process of pairing Nodes and Gateways is as easy as possible. Nevertheless, careful forethought and planning may still be required, especially if you have intentions of maximizing the ranges between the devices. In both standard-range and long-range configurations, the name of the game is ‘line-of-sight’. Although we all wish it were as simple as having the devices within visual range, connected by an imaginary line, there just so happen to be many variables that add physical and non-physical obstructions between the devices themselves, making device-to-device communications more challenging.
Physical barriers and other factors
The Acclima Nodes and Gateway communicate with each other using the 915MHZ ISM band. This is a heavily used band and is highly restrictive of the power levels and field intensities used in it. As the local use of the band becomes denser, the associated range for all users in that area is reduced because of the noise from competing signals. Frequency Hopping Spread Spectrum technology is used to greatly reduce these interferences and is the key to success in achieving long ranges with small power levels. High-gain antennas are not allowed because they concentrate the radio frequency power and increase the interference to other users. Using the permitted omnidirectional antennas at low power levels means that only a very small fraction of the transmitter output power is aimed in the direction of the receiver and most of the radiation is absorbed by the surrounding environment.
With these restrictions and physical limitations, it is important to maximize the power received by the receiver by considering the following:
Establish line-of-sight communications. Hopefully, your communications path between the Node and Gateway is free of buildings, hills, trees, and crop canopies. In crops such as corn, it may be desirable to raise the antenna to an elevation above the crop canopy where it can see the antenna with which it is communicating. If this is not practical, you will still be able to communicate for about one mile according to the testing we have done.
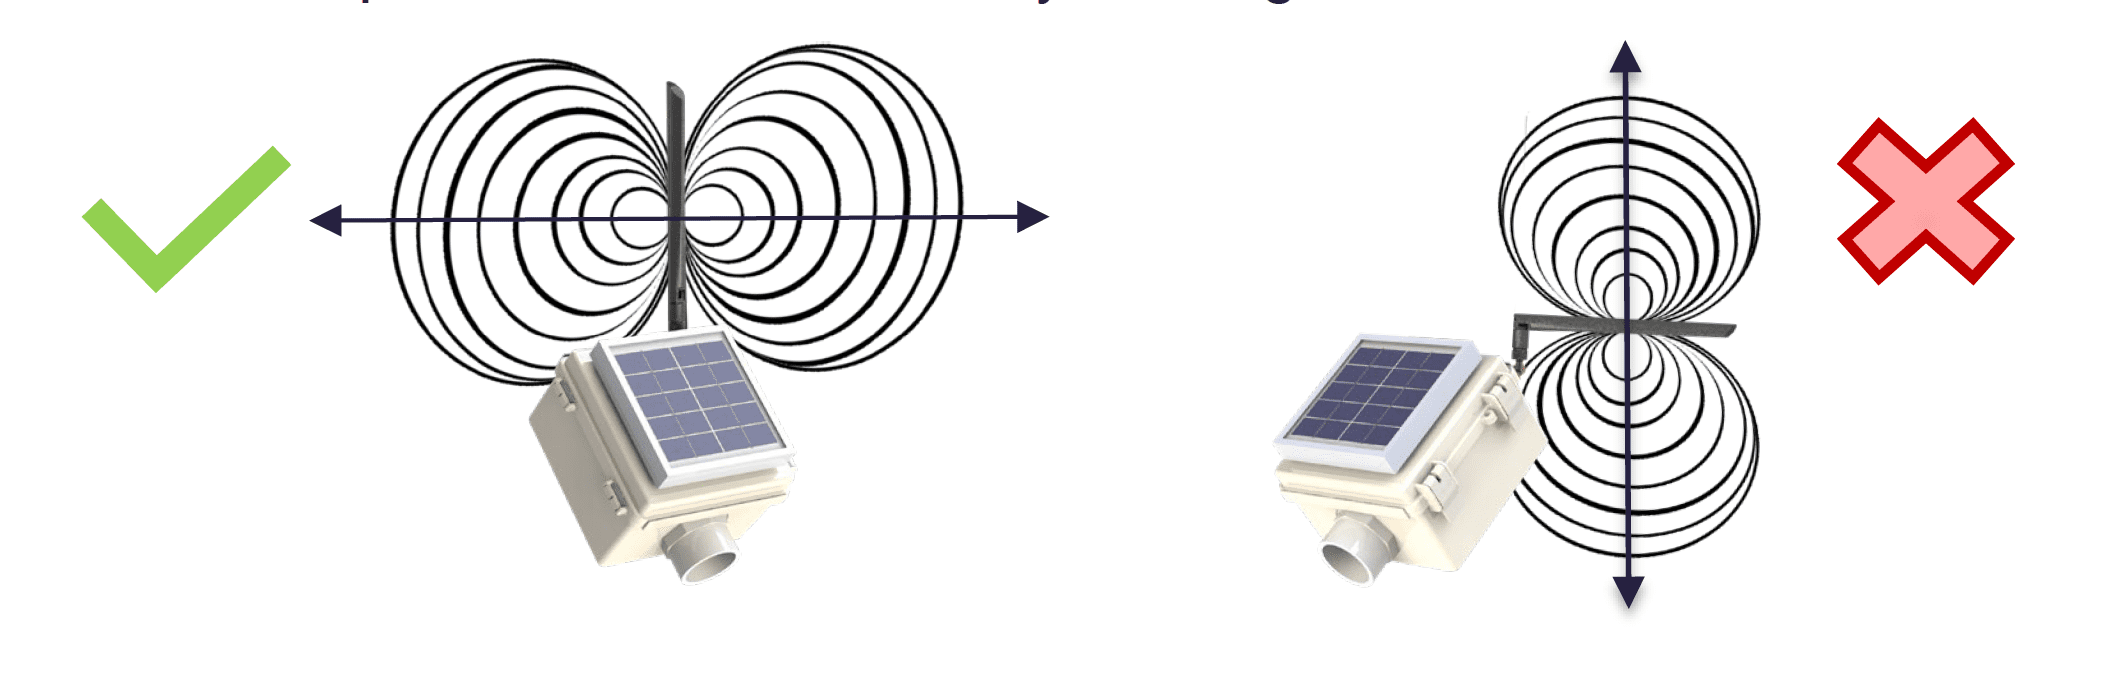
Make sure the antennas are in a vertical position. Omnidirectional whip antennas produce a flattened donut-shaped field. The most intense part of the field for both transmitting and receiving is straight out (perpendicular to the antenna) in all directions. The weakest signal strength is at the tip of the antenna. If the antenna is mounted parallel to the Earth very little signal will be transmitted or received by the antenna.
Provide reasonable clearance from the ground. Signal strength is impaired by objects that reside within a cigar-shaped path called the Fresnel Zone. The radius of this zone for 915 MHz communications is roughly 20 meters. Envision a tunnel about 40 meters in diameter between the Node and Gateway and keep it as clear as possible from interfering objects – including the ground. It is generally not practical to place the antennas 20 meters above the ground, but it is a good idea to keep them at least 1 meter above the ground. In our range testing the antennas were at eye level. That provides good communications at 5 miles.
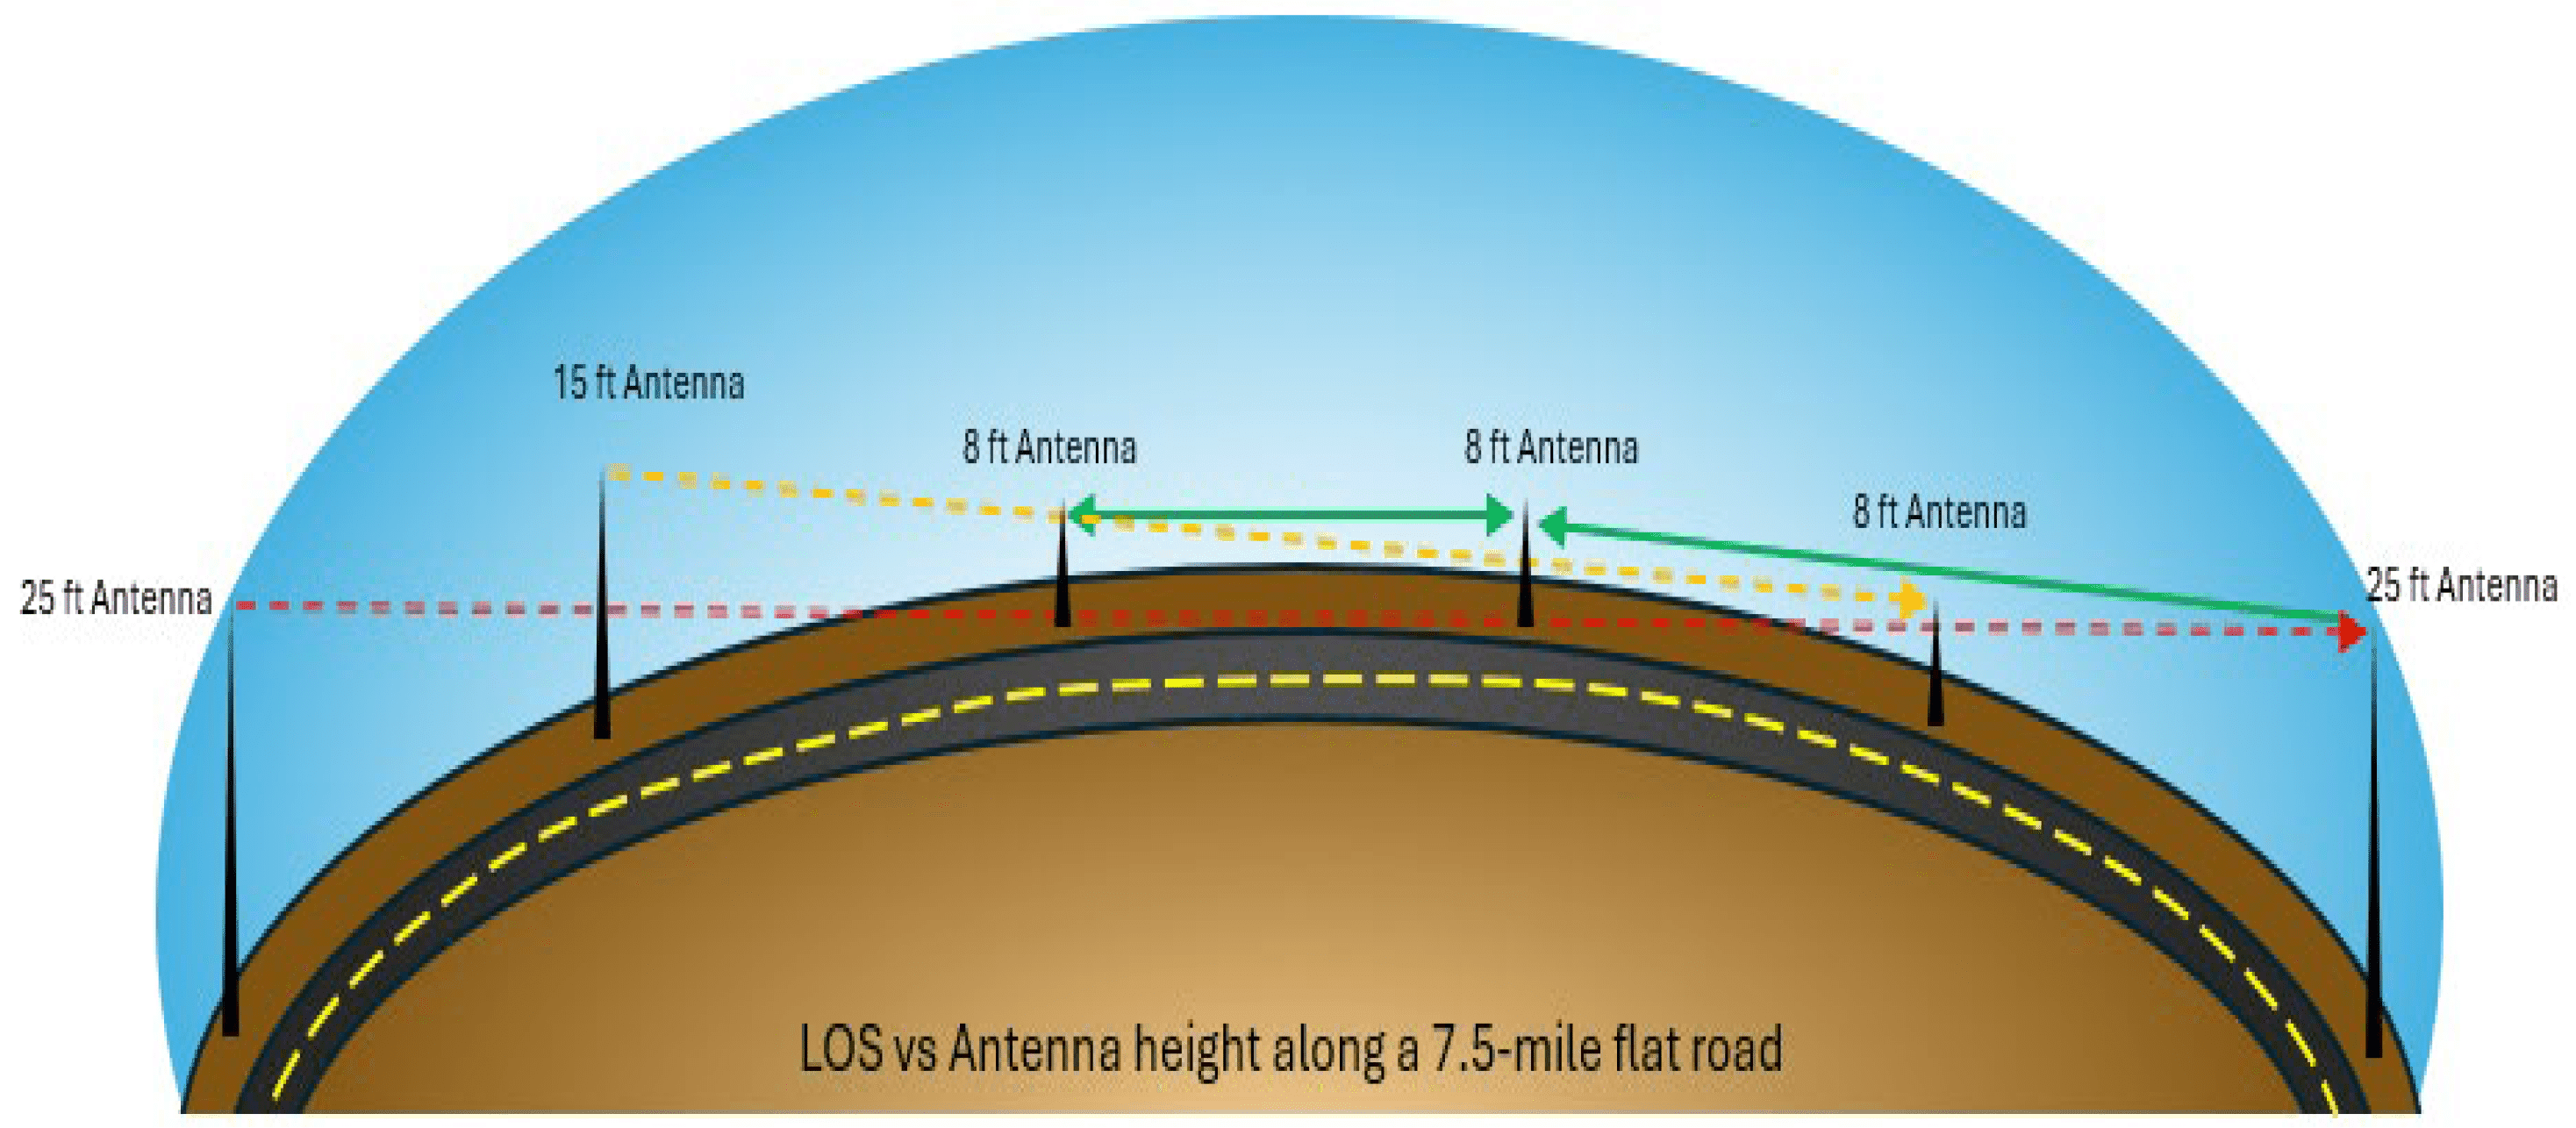
The height of the antenna from the ground directly impacts signal strength. At lower installation heights, there will be less signal to spread due to a large percentage of the wave being absorbed by the ground. At lower heights, there is a greater requirement for the Fresnel Zone to be clear of any obstruction. Elevate the transceiver antenna to 15-25 feet to reach a
5-mile or more in range, with a clear line of sight path.
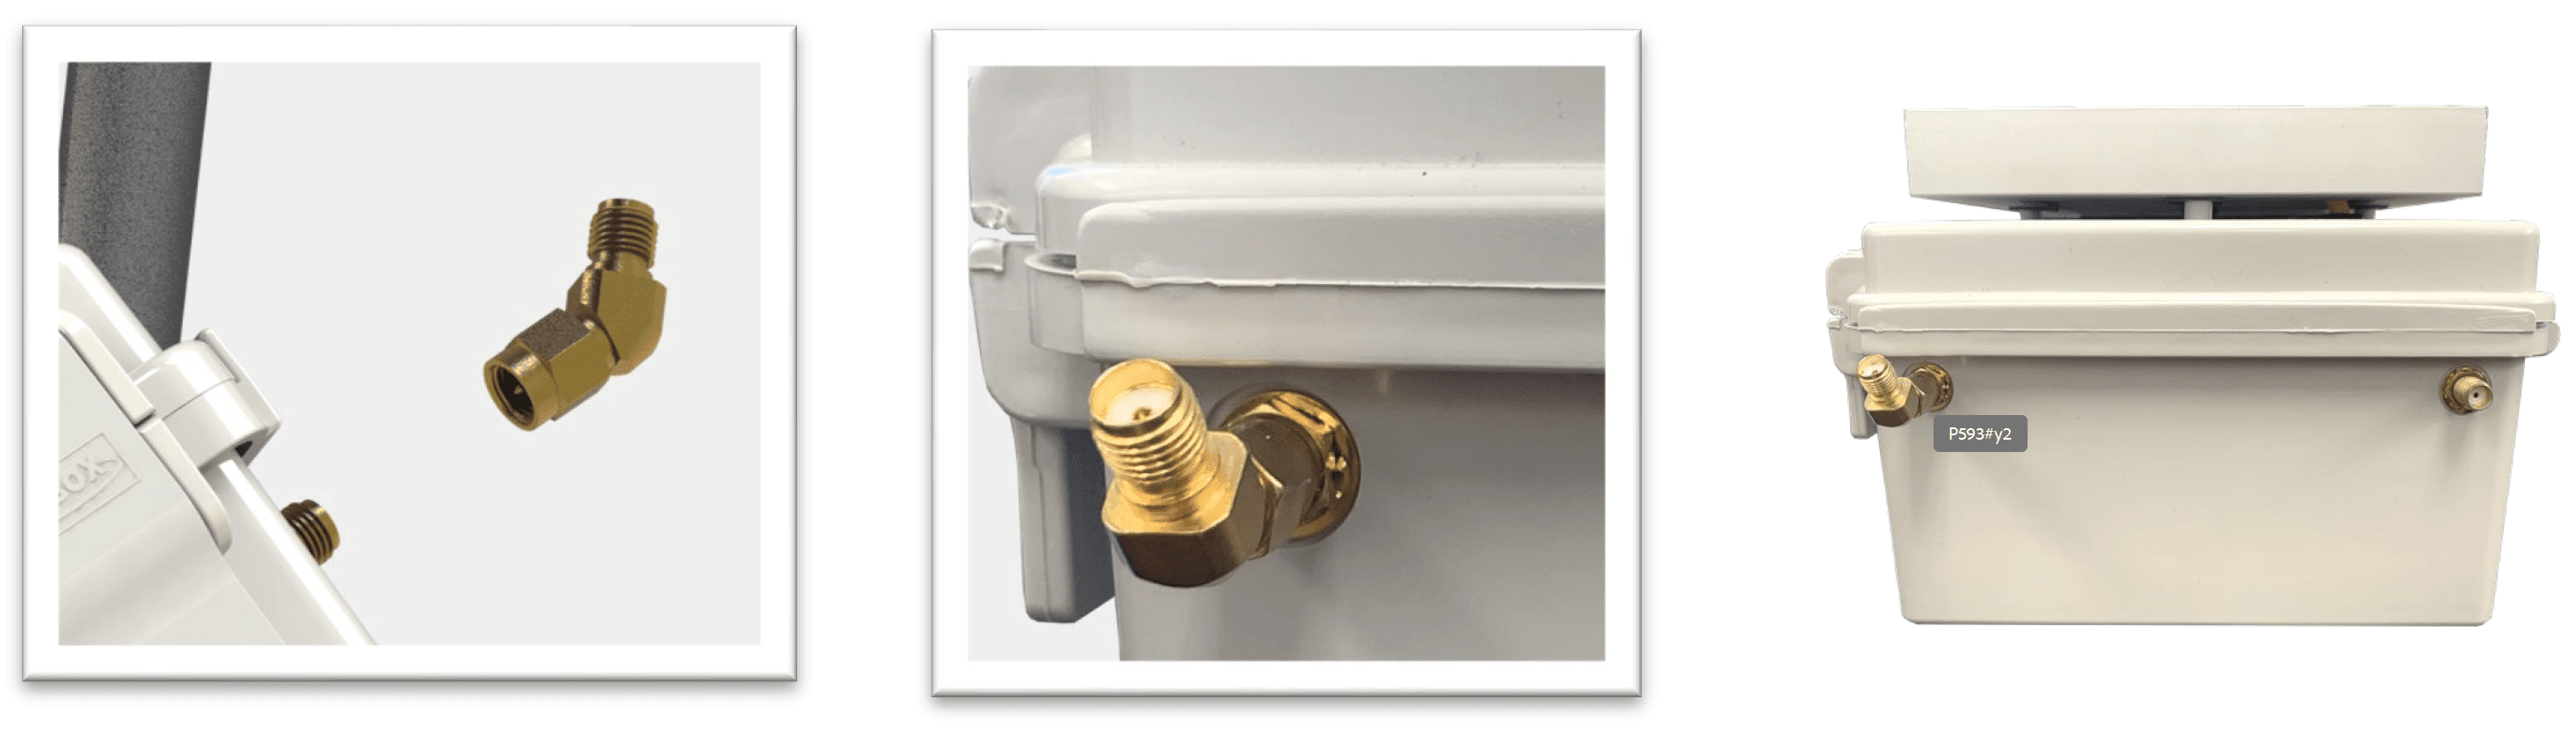
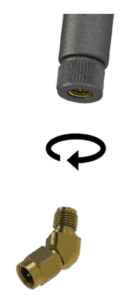
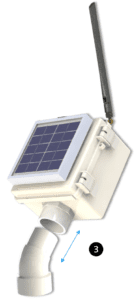
LoRa Radio Antenna
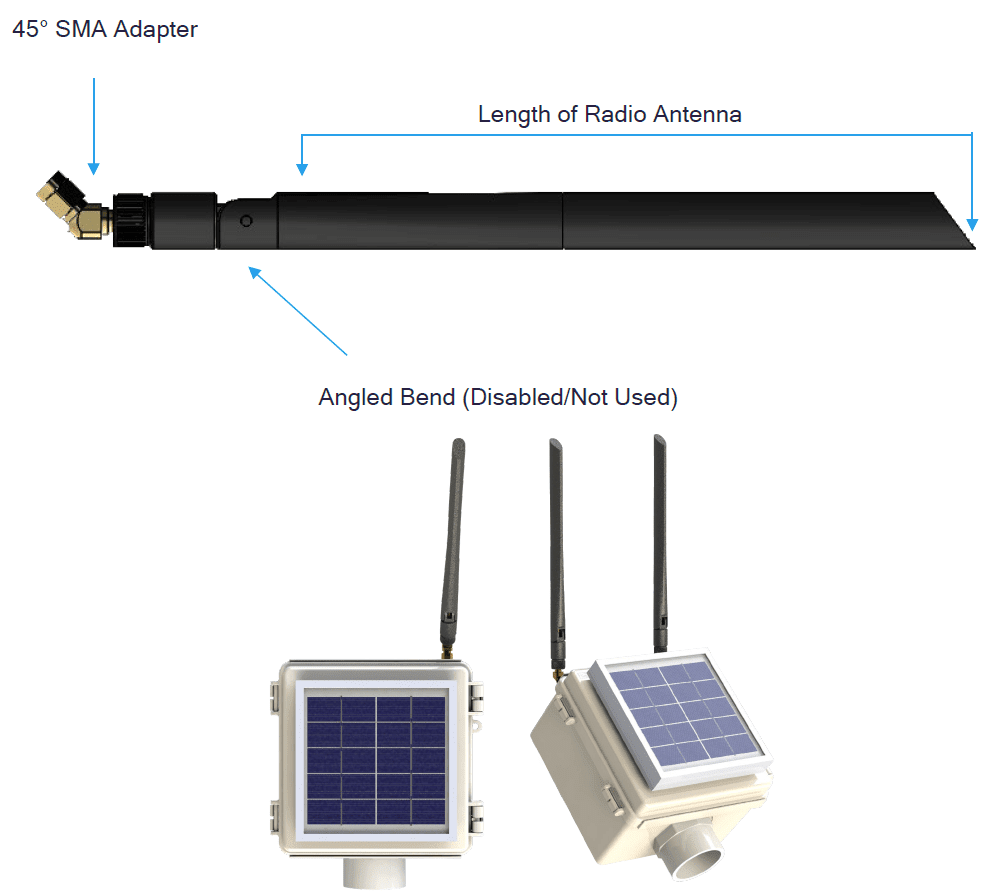
Installing your antenna correctly is imperative to achieving good signal transmission and reception. The LoRa radio antennas must be kept in the vertical position to allow the length of the antenna’s surface area to capture in or transmit-out, as much signal as possible. The Solar Nodes and Gateways are to include a 45° SMA adapter. This adapter helps to ensure the antennas will always remain at 90°. The angled SMA adapter can be removed for a <1% improvement in signal quality. However, doing so removes the antenna’s ability to retain a secure fixture, as the built-in antenna connector can easily become loose, and then roll over to a less-than-ideal position. In most units, the antenna’s angled bend has been disabled at the factory. Keeping the 45ׄ° adapter reduces the need for regular maintenance to right the antenna back to its proper vertical position. In most cases, the 45° SMA adapter will be pre-installed onto the enclosure.
Hardware Assembly Steps
LoRa Antenna
1. Screw the 45° SMA adapter to the SMA connector on the rear of the enclosure. Use the included wrench found in the hardware kit to tighten the nut onto the bolt.
- Note: Make sure the 45° adapter is screwed down and arrives in the vertical/skyward position.
2. Screw down the LoRa radio antenna clockwise onto the 45° male SMA adapter.
3. After the Antenna has been affixed to the SMA connector, the antenna should remain in the upright position for the duration of the installation.
Neck and Elbow Adapter
For ease of installation, we recommend the following steps to secure the Neck and 45° Elbow to the Node/Gateway Neck and 45° Elbow to the Node/Gateway enclosure.
- With the Node/Gateway lid open, insert the neck adapter into the enclosure port hole at the bottom.
- Screw the locking nut down onto the Neck with the teeth of the locking nut facing down.
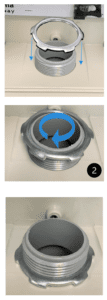
- Push the 45° Elbow into the Neck. Friction between the elbow and neck will hold them together in place.
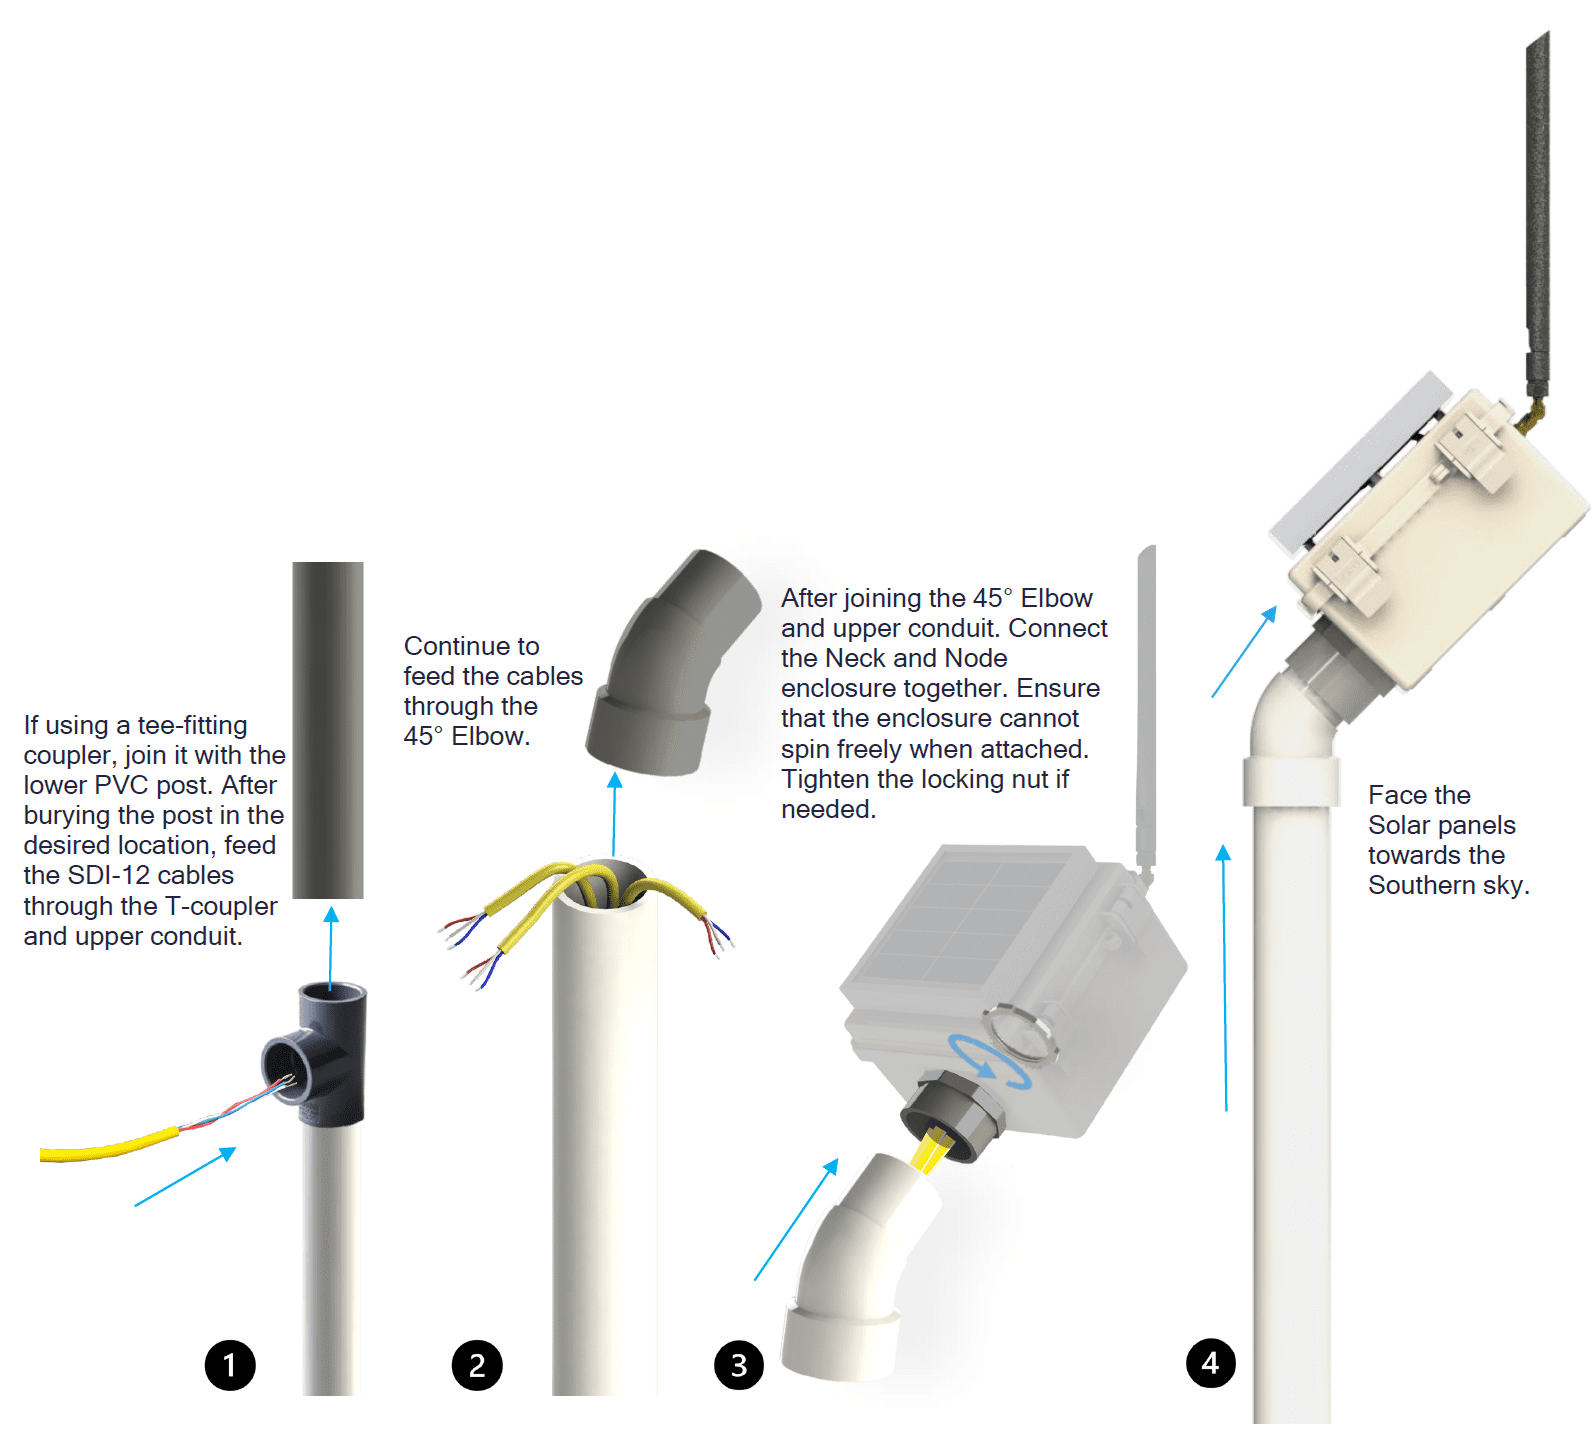
 PVC Mast/Post Installation
The Node and Gateway were designed to use a 1 ¼ inch PVC pipe as a mast to erect the Solar Node or Gateway above ground. We recommend using a 1 ¼ Schedule 40 Furniture PVC Pipe, approximately 6-10 feet long. However, these materials are not included and cannot be sourced through Acclima. They are commonly found in local hardware stores or online retailers at relatively reasonable costs. The Solar Node and Gateways do include a PVC Neck, and 45° elbow adapter, designed to aid the user in coupling the Node or Gateway to a conduit and still achieve the appropriate angle for solar energy absorption. The 45° elbow has a thin end, designed to fit snuggly into the Neck Adapter, and is secured by the locking nut.
Node Post/Conduit Coupling
For Solar Node installations, a 1 ¼ inch Tee Fitting/ 3-way PVC connector can be used at the surface level to connect a conduit and a post. This provides an additional channel for routing cables above ground. If a Tee coupler is used for a Solar Node, a 2 ½ ft, 1 ¼ inch sch 40 PVC pipe should be inserted into the ground and joined with another 1 ¼ inch SCH 40 PVC conduit tall enough to clear the crop canopy.
A Gateway will not need such a connector and a straight pipe tall enough to provide a view of the Node will be sufficient for proper installation. All tests were performed with masts of approximately 5-8 ft tall.
Interface Options (I/O)
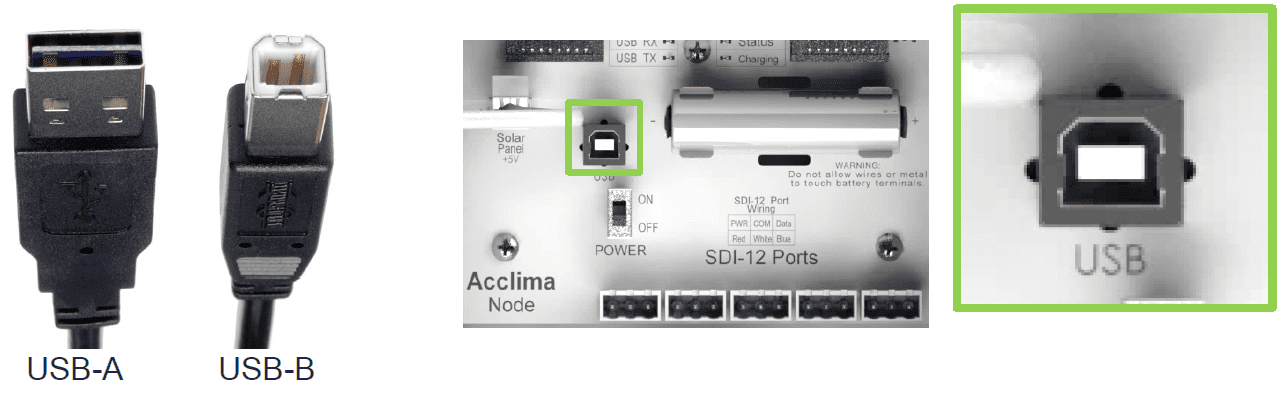
USB 2.0 A-B Port
The Acclima Solar Nodes and Gateways are equipped with a USB-B port. Use a USB-A to B cable to connect the Node or Gateway to your Windows 64-bit PC. You can configure or sync data from the device directly to your PC via such a cable. Drivers are installed automatically once a connection has been established.
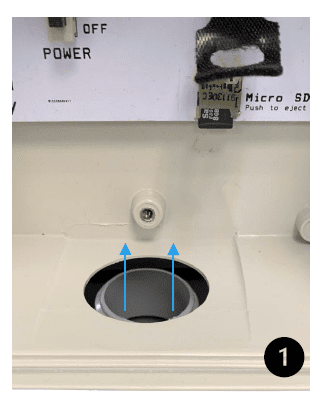
Micro SD Card
The Gateway stores data via an 8GB memory card. SD/SDHC/SDXC Micro SD Cards using the Fat 16/32 formats are supported.
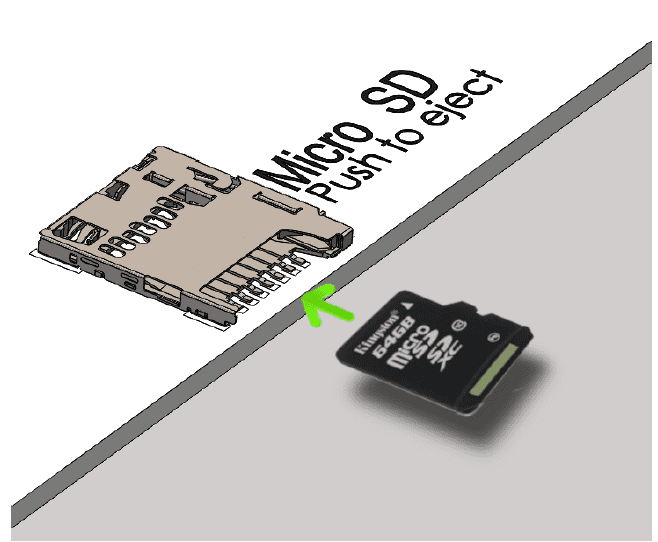
i. The Micro SD card should only be installed with gold contacts facing down, and the branding on the card facing up.
ii. To insert a Micro SD card push it into the MicroSD card slot until an audible ‘click’ can be heard or felt.
iii. Push the card inward a second time to release or eject the MicroSD card.
Nano Sim Card
A pre-activated Nano sim card can be found in the Nano sim card slot at the top center of the radio module, inside the Gateway enclosure.
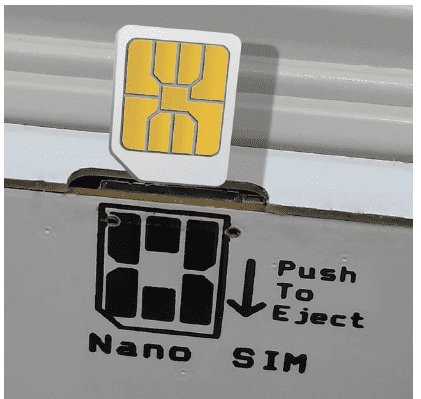
Note: If a Nano Sim is not Included, install an Acclima-activated GSM Nano Sim Card with the gold contacts facing towards you, with the cut-corner on the left-hand side pointed downward. Push the Nano Sim gently into the locking connector. You will hear an audible click when it is seated properly. Otherwise, refrain from removing the Nano Sim card once it has been seated. Change the APN settings to correspond to the new carrier. Contact Acclima for activation guidance if a non Acclima SIM card will be used with your Gateway.
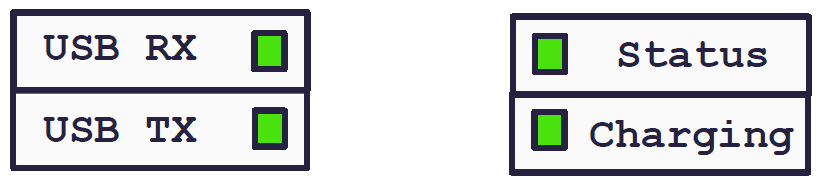
Activity LEDs
Located on the top center of the motherboard. There are 4 Activity LEDs found on both Nodes and Gateways.
USB RX:
When SDI-12 device data is being received, the USB RX LED will flash green in correspondence with the data flow.
USB TX:
When data flow is being transmitted through a USB cable. USB TX LED will flash green rapidly in correspondence with the data flow.
Status:
The LED has many states and will inform the user of the device status, indicated by series of flashes in a certain sequence depending on the mode the device was placed into.
Charging:
When current is provided by either the Solar Panel 5v cable or a USB connection, the charging LED will illuminate solid green. This light will not illuminate if the battery cannot be charged or is full.
Status LED Modes
The Nodes and Gateway have different modes that can be toggled on at any time to perform a system or site diagnostic. Using these modes appropriately can greatly improve the system’s network stability.
Normal mode:
This mode is engaged by flipping the power switch from OFF to ON, in a Node or Gateway a single time. When started, the status LED will flash once every 5 seconds and again after a reading is collected, this indicates a healthy system. Two blinks every 5 seconds indicates that no devices are communicating with each other or to the cloud. A very low brightness, slowly pulsating blink indicates a voltage lower than 3.6v is being supplied by the battery, and it should be replaced, recharged manually or recharged by adequate solar current.
Site Check Mode:
This mode is engaged by flipping the power switch from OFF to ON twice. The Gateway will flash twice to confirm the Site Check Mode is selected by repeating two flahes. After enabling this mode on a Gateway, a message is sent to the cloud through local GSM coverage. This is visualized by two pairs of double flashes that occur every 5 seconds. After about a minute, an SMS text message is sent from the Acclima Data Portal to the phone number on the file, detailing the configuration information detected. This feature may not be available on some hardware revisions.
Cellular Network Strength Report Mode
This mode is engaged after the user flips the power switch from OFF to ON in a Gateway three times. Three flashes immediately reply to the user to confirm the Cellular Network Strength Report Mode is active. After entering this mode, the status LED flashes quite rapidly. The speed of the LED flashes indicates signal strength. As the flashing speed increases, the LEDs appear more solid. This is meant to visualize signal strength between the Gateway and the cell network. After about 10 seconds a grade is assigned from one flash to five flashes. 1 being the slowest speed detected and 5 being the fastest. Aim for 3 or better for a strong reliable network.
LoRa Radio Strength Report
This mode is engaged after the user flips the power switch from OFF to ON in a Node three times. Three flashes immediately reply to the user to confirm the LoRa Radio Strength Report Mode is active. After entering this mode, the status LED flashes quite rapidly. The speed of the LED flashes indicates signal strength. As the flashing speed increases, the LEDs appear more solid. This is meant to visualize signal strength between the Node and the Gateway in the network. After about 10 seconds a grade is assigned from one to five flashes. One flash being the slowest speed detected and five flashes being the fastest. Aim for 3 or better for a strong reliable network. This feature may not be available on some hardware revisions.
Installing Soil Moisture Sensors I
Supported Soil Moisture Sensors
The Acclima Solar Node will support all SDI-12 sensors that are compatible with versions 1.0 through 1.4 of the SDI-12 specification, including all Acclima TDR sensors. When using Acclima sensors these first five data points are captured.
- Volumetric Water Content %
- Temperature °C
- Permittivity
- Bulk Electrical Conductivity µS/cm
- Pore Water Electrical Conductivity µS/cm
The Solar Node SDI-12 power is limited to 400mA. Some sensors with higher power requirements may require an external power connection.
Sensor Orientation
Sensors should be installed in the region of interest where soil moisture measurements are desired. Acclima sensors measure the average volumetric water content over the length of the sensor rods. Sensors can be buried in any orientation and will produce average readings as follows:
- Flat/Horizontal: Provides a moisture reading at a discrete depth. This orientation is frequently used when monitoring plants with shallow roots such as turf, or when multiple sensors are used to create a soil moisture profile vs. depth.
- Vertical: Provides average moisture reading over a depth of about six inches. Often used when monitoring deeper root systems such as trees.
- Edge-Horizontal or diagonal: Provides average moisture reading over a variable depth.
Environmental Variables
When selecting a site for sensor placement, consider the following environmental factors:
- Non-permeable surfaces such as rocks and roads can generate runoff and cause variation in moisture content nearby.
- Depressions and the base of slopes tend to collect excess moisture.
- Peaks of slopes, south or west-facing hillsides, and areas where reflected light is focused tend to dry out more quickly.
If monitoring plant conditions, the sensor must be buried among the roots of the plant of interest. Otherwise, the effects of transpiration will not be measured.
Installing Soil Moisture Sensors II
The Acclima Soil Moisture sensors report soil moisture as a percentage of the total volume measured. This means that the measured volume of soil should be free of foreign objects or variations that may alter the measurement made by the sensor. Consider the following conditions:
- Avoid placing the sensor near rocks or other similar objects.
- Small roots near the sensor are acceptable and desirable. Avoid large woody roots.
- Do not create air pockets or voids around the sensor rods during installation.
- Force the sensor rods straight into undisturbed soil using the Acclima-supplied guide tool. Sensors with waveguides installed with backfilled, compacted soil may not report a VWC number that is representative of the nearby undisturbed soil.
- Where sensors are installed in the sidewall of excavations, be sure to replace and compact all the excavated soil to the same density as the surrounding unexcavated soil. Otherwise, preferential percolation paths may be created which can cause errors in VWC readings.
- Avoid placement of sensors within the Volume of Influence of one another. For Acclima sensors this is within a two-inch diameter around the sensor, other sensors may have a larger or smaller volume of influence.
Add Acclima Sensors
To add one or more Acclima sensors to the Solar Node:
- Wire each Acclima sensor to the Solar Node as described in the ‘SDI-12 Device termination’ section.
- Click the sensors tab in NodeView
- Click Start Scan.
- Set a New Address0-9 (do not duplicate address characters on any single Node!)
- Repeat the above steps for each Acclima sensor.
Add non-Acclima Sensors
Like Acclima sensors, each non-Acclima sensor must be added individually to the Node:
- Physically disconnect the wires of all existing sensors from the Node.
- Wire the new sensor to the Node as described in the ‘SDI-12Device termination.’
- Click the Sensors tab in NodeView.
- Click Start Scan.
- Set a New Address0-9 (do not duplicate address characters on any single Node!)
Note: If a sensor is moved from one Node to another, you may need to check for duplicate addresses. Sensors moved, will be hidden from a Node after 72 hours.
SDI -12 device termination
How to Wire
Proper termination of SDI-12 connectors is key to capturing reliable data from SDI-12 devices. Follow these steps to ensure your wiring is done correctly on the first try. You will need a 1/8” flathead screwdriver or similar tool to complete this task.
- Insert the wire terminals into the open port of the terminal block connector.
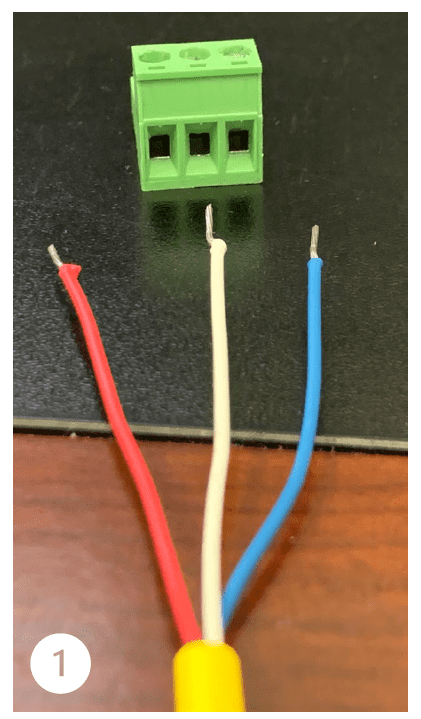
- Use a 1/8” flathead screwdriver to screw the terminal contact closed onto the wire terminal. Avoid allowing the insulation to interfere with the contacts of the terminals.
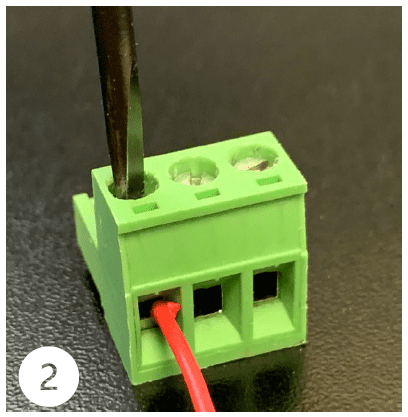
- Repeat the process for the remaining wire terminals.
NOTE: The SDI connector may arrive in a mouth-closed or open configuration. Before inserting wire terminals make sure that the mouths of the block are screwed open so that the metal contacts may be closed onto the wire terminal.
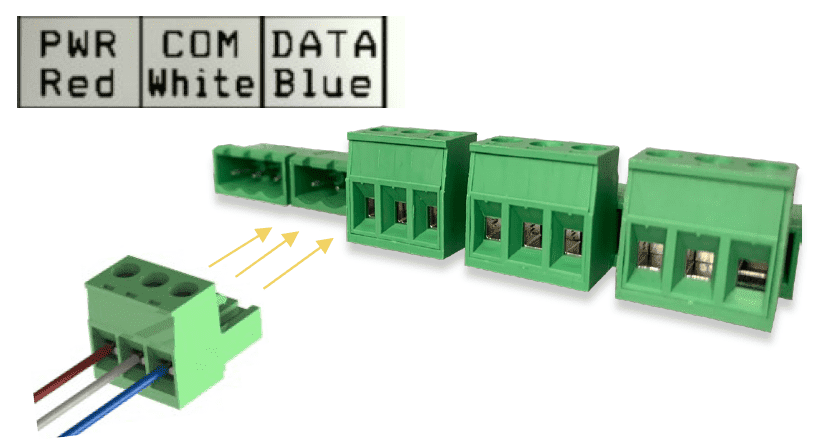
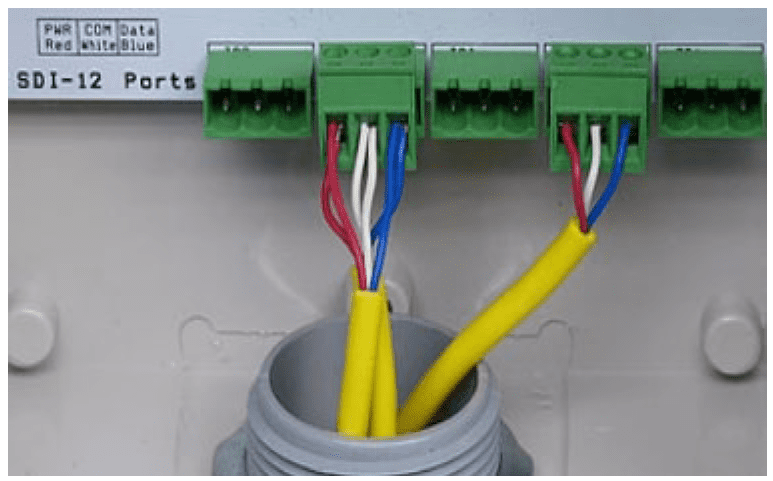
Connecting Sensors to the SDI-12 Port
SDI-12 sensors communicate and draw power from the same wires. They share the connection to the Solar Node with all other sensors connected to the same Solar Node. This type of connection is sometimes called ‘parallel’ or ‘bussed.’ Sensors can be spliced or connected at a single common point or as taps into a longer run of wire.
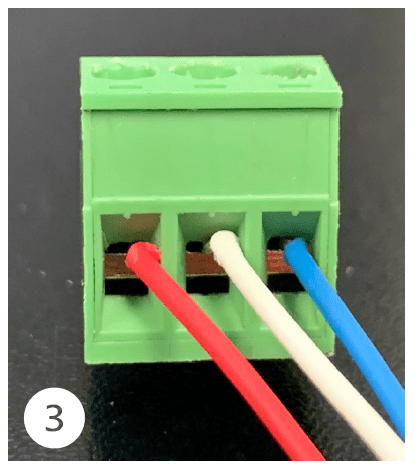
Upon wiring completion:
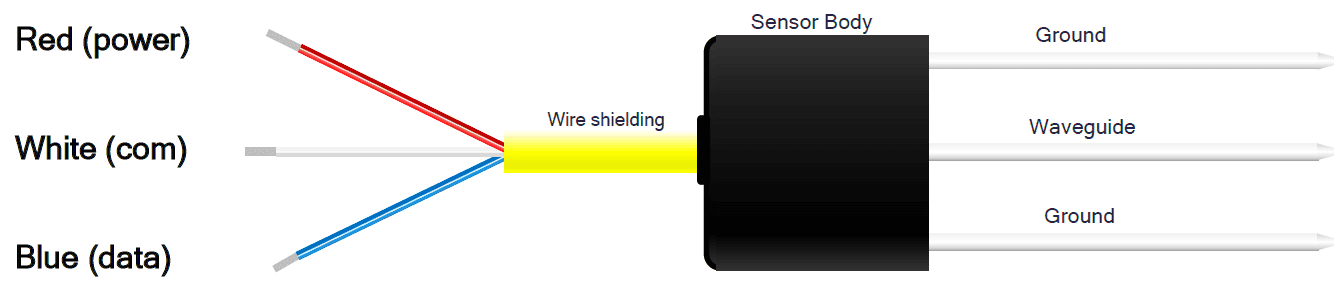
- Every sensor red wire has electrical contact with the red ‘Power’ terminal
- Every sensor white wire has electrical contact with the white ‘Com’ terminal.
- Every sensor blue wire has electrical contact with the blue ‘Data’ Terminal
Consider the following points when wiring sensors:
- The maximum recommended wire length from a sensor to the Solar Node is 200 feet.
- For convenience, the green terminal block can be removed from the SDI-12 port while wires are connected to it. Simply pull on the block to remove it from the inside of the Solar Node. To connect the terminal block, insert it back into the Solar Node with the screws facing right.
- One or two sensors can easily be wired directly into the green terminal block as shown above. To do this, insert all red wires into the left portion of the terminal block and tighten the screw to secure them in place. Repeat the procedure for the white wires in the middle portion of the block and the blue wires in the right portion of the block.
- When connecting ten sensors to one Solar Node, multiple wire splices will be necessary. This can be performed by repeating the dual wire splice procedure on each of the five provided SDI-12 terminal blocks. Each of the terminal blocks will have two wires in each of the three terminal ports on the block. Provided the total power draw does not exceed 400mA and you have previously addressed the sensors 0-9, the Node will detect and support the sensors.
Nodeview
NodeView™ Software & Driver software must be installed onto a Windows™ PC before the system can be set up in the field. The Solar Node and Gateway require a Windows™ driver to be installed before a connection with a PC is possible. The driver is typically installed during the USB connection with a Node/Gateway with a PC for the first time. If this process is missed NodeView™ will install drivers during its initial setup.
Minimum System Requirements
- Microsoft Windows 7™, Windows 8.1™, Windows 10™, or Windows 11™ operating systems
- 50 MB hard drive space
- Available USB port
NodeView App Installation
Driver
When the Acclima Solar Node is first connected to the computer via a USB cable and the device is powered [On], it will automatically be detected by the operating system and the installation of the driver will occur. Once the driver is found and installed, the Solar Node will be assigned to a port and will be available for use. To view more details about the port, open the ‘Device Manager’ in the Windows™ Control Panel. The Solar Node is visible in the Device Manager under the ‘Ports (COM & LPT)’ heading. The Device Manager only shows active ports by default. When the Node is disconnected from the computer, it will no longer be visible in the Device Manager, unless unhidden in the Ports (COM & LPT) menu.
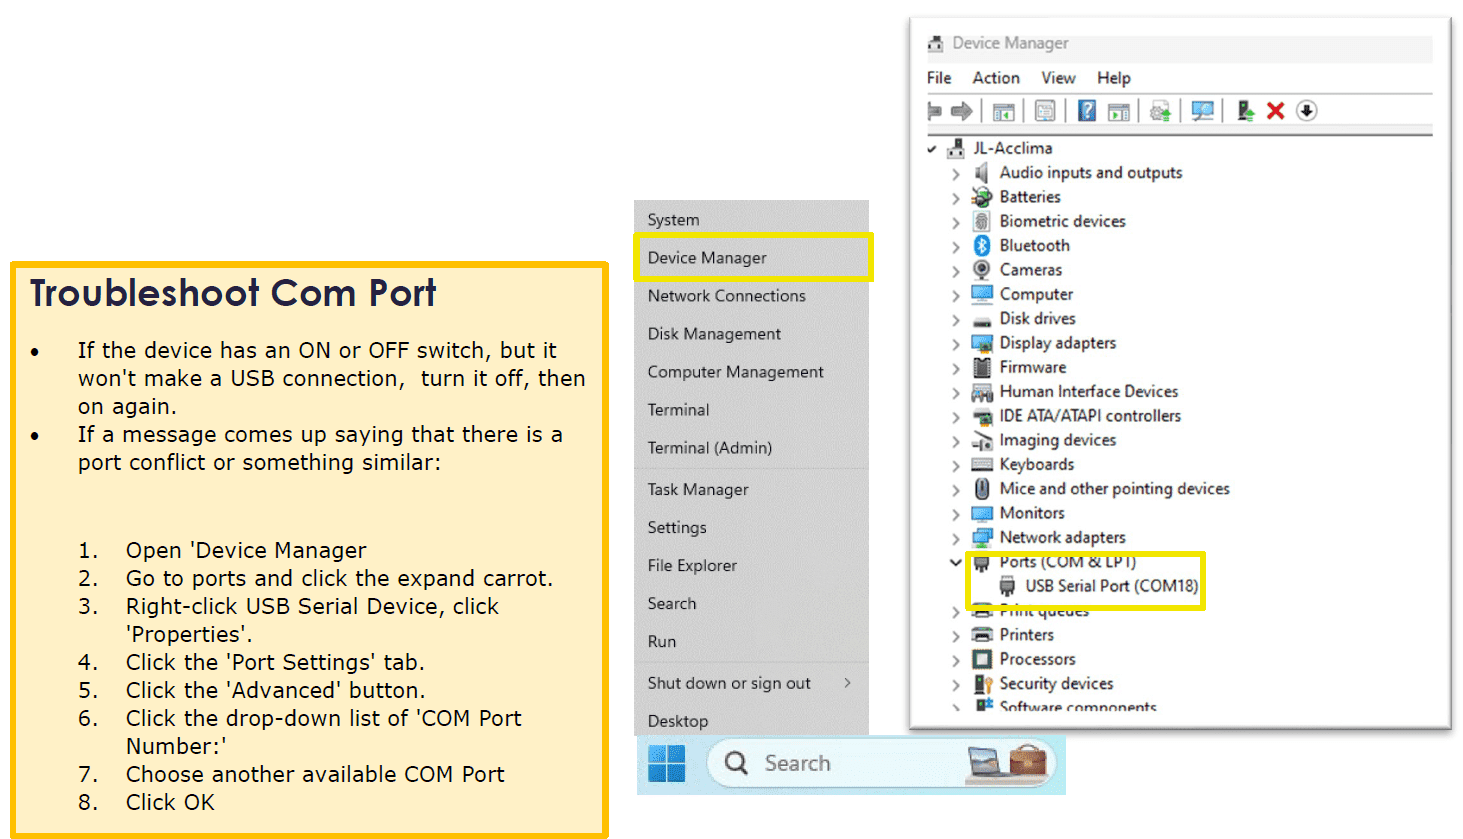
Note: Device manager can be found by using the search icon in Windows™ and entering “device manager” or by right-clicking the Windows™ icon on the taskbar.
Installing NodeView Software
Installing NodeView™ is simple and easy. Download the NodeView setup application. Visit the following webpage to start the download process.
The NodeView™ software can be downloaded here.
NOTE: The screenshots and steps below may vary slightly depending on which version of Windows™ you are using.
NodeView™ Installation I
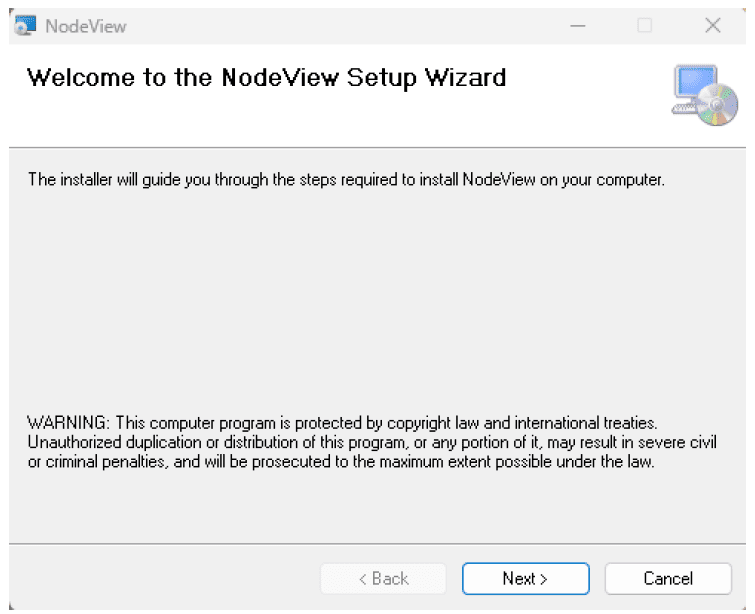
Find the installer in the Downloads location on your drive. Double-click the installer to begin the set-up process.
Click ‘Next’ to proceed through the installation.
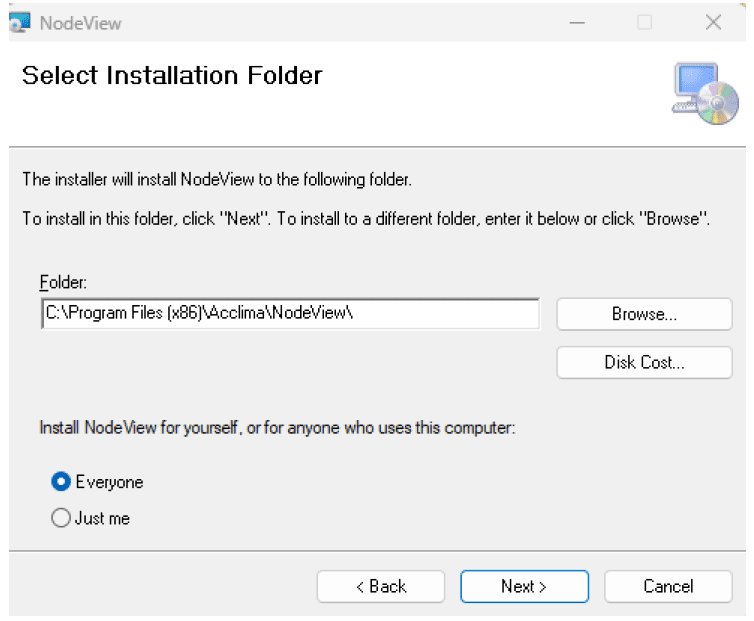
You may pre-determine the destination where the installation folder will be stored.
The default location is set to create a folder for Acclima NodeView’s components in the OS drive location.
Note: We do not recommend setting the installation destination to a flash drive.
Click ‘Next’ to proceed through the installation.
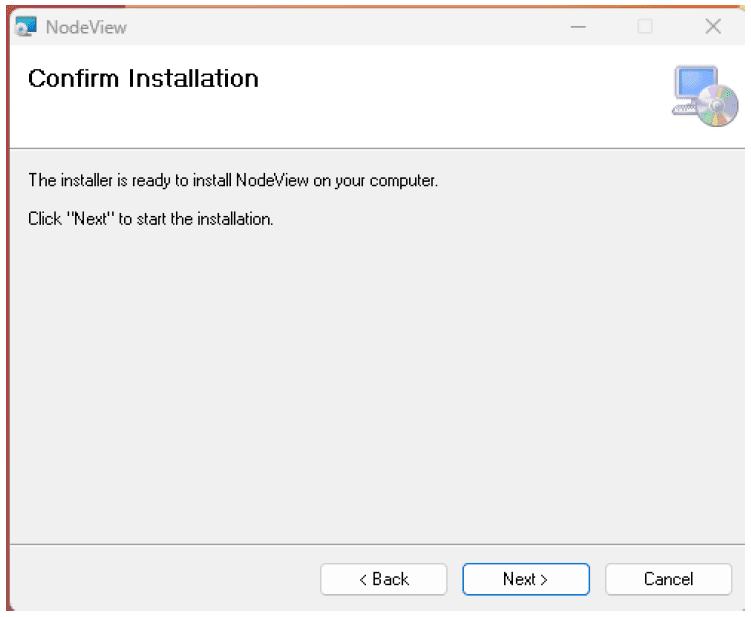
Installation Steps II
The installation process begins and will prompt a request to approve ‘Administrative Privileges’ to make appropriate changes to the system.
Installation may take a few moments.
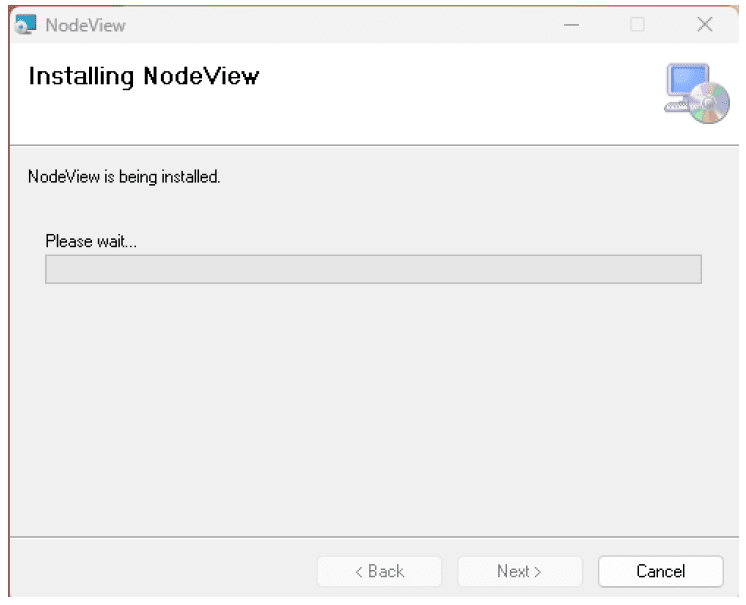
Installation is completed and you may close the installer window.
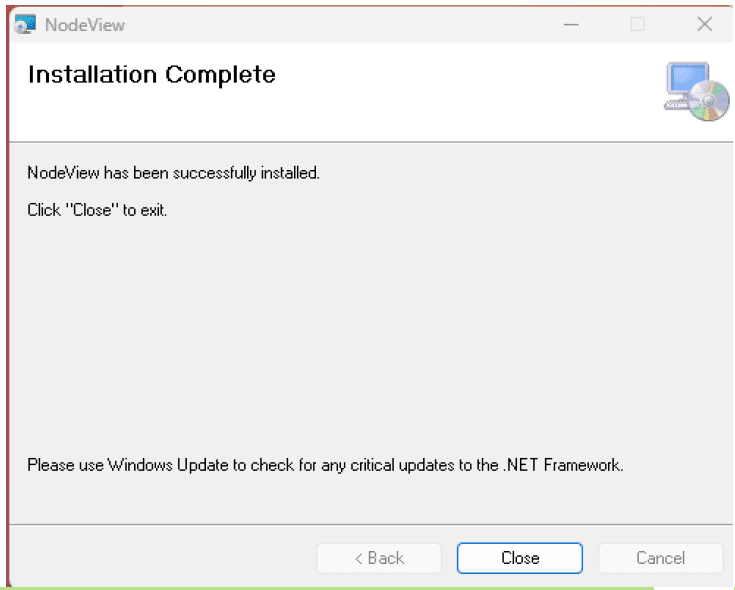
Click ‘Close’ to start using the app.
Using Acclima NodeView Software
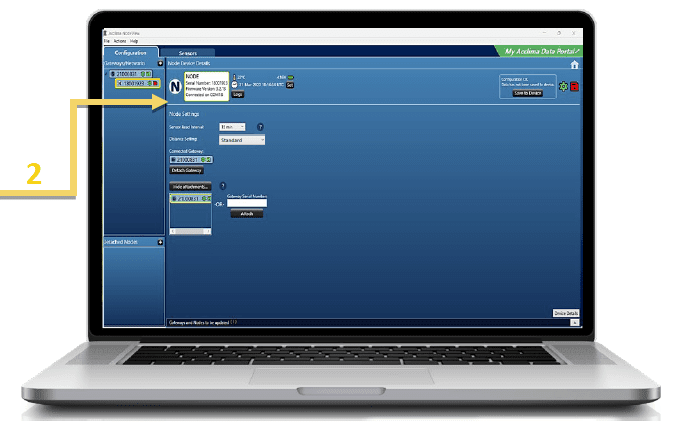
NodeView™ Layout
Here is a breakdown of the components of NodeView™ when a Solar Node has been selected.
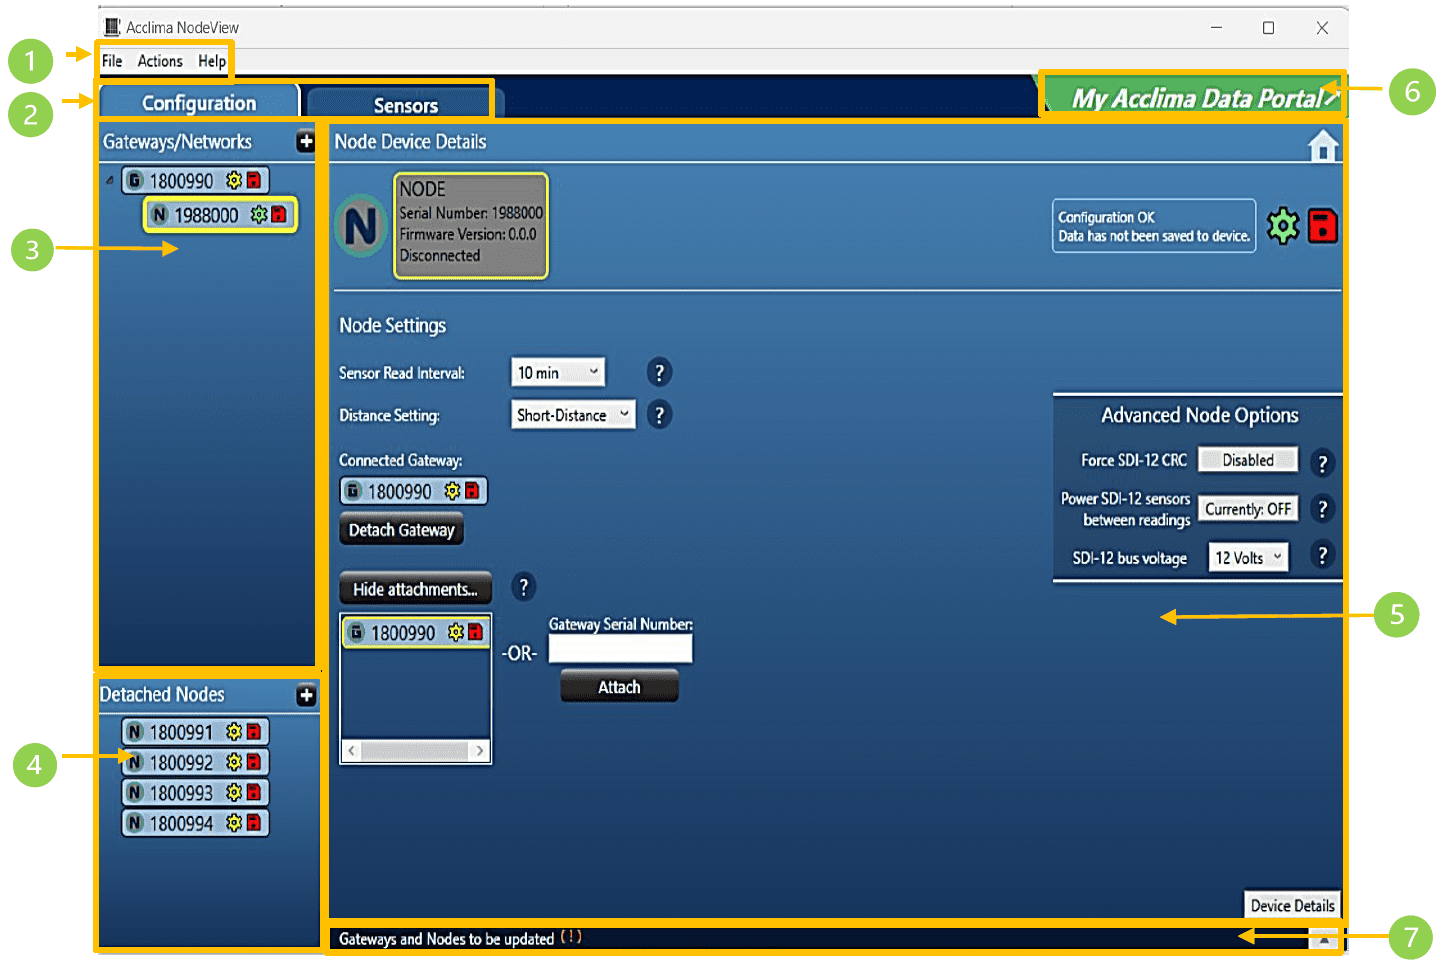
Use the numbers to identify the sections of the NodeView™ App.
- Action Menu
- Action Tabs
- Gateways/Networks
- Detached Nodes
- Device Details and Configuration Options
- Shortcut to data.acclima.com
- Activity Log
How to Use NodeView™
The Acclima NodeView software provides three essential functions:
- Node configuration – configuring Node or Gateway for operation.
- Configuring a Network of Nodes with a Gateway.
- Addressing SDI-12 devices and sensors.
Connecting a Node to NodeView™
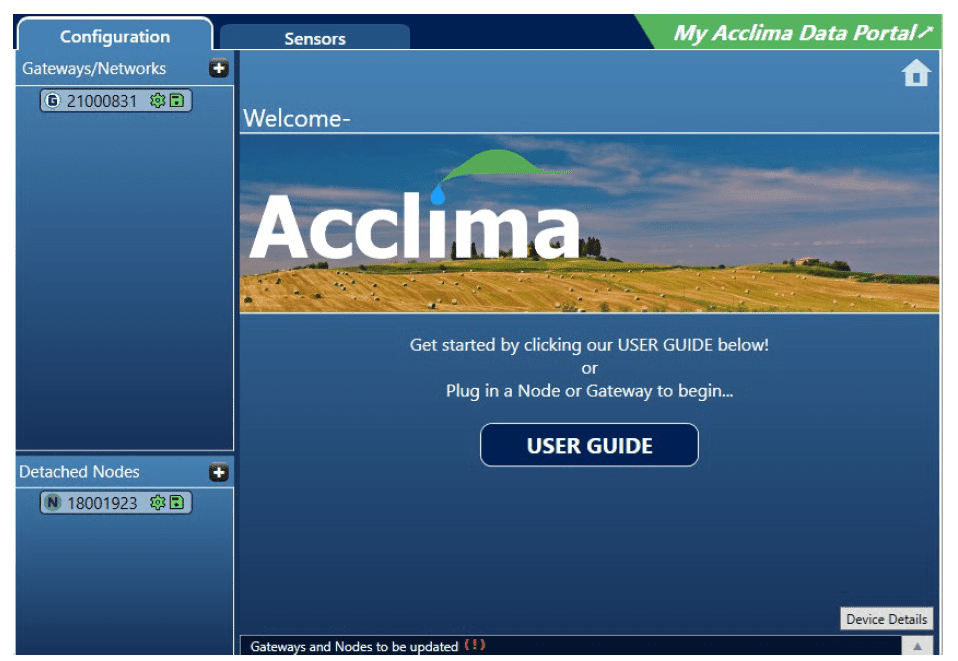
- After installing the NodeView™ software, please connect a Node via USB, turn the power [ON], and open the application.
- With NodeView™ open you should see something like the following screenshot:
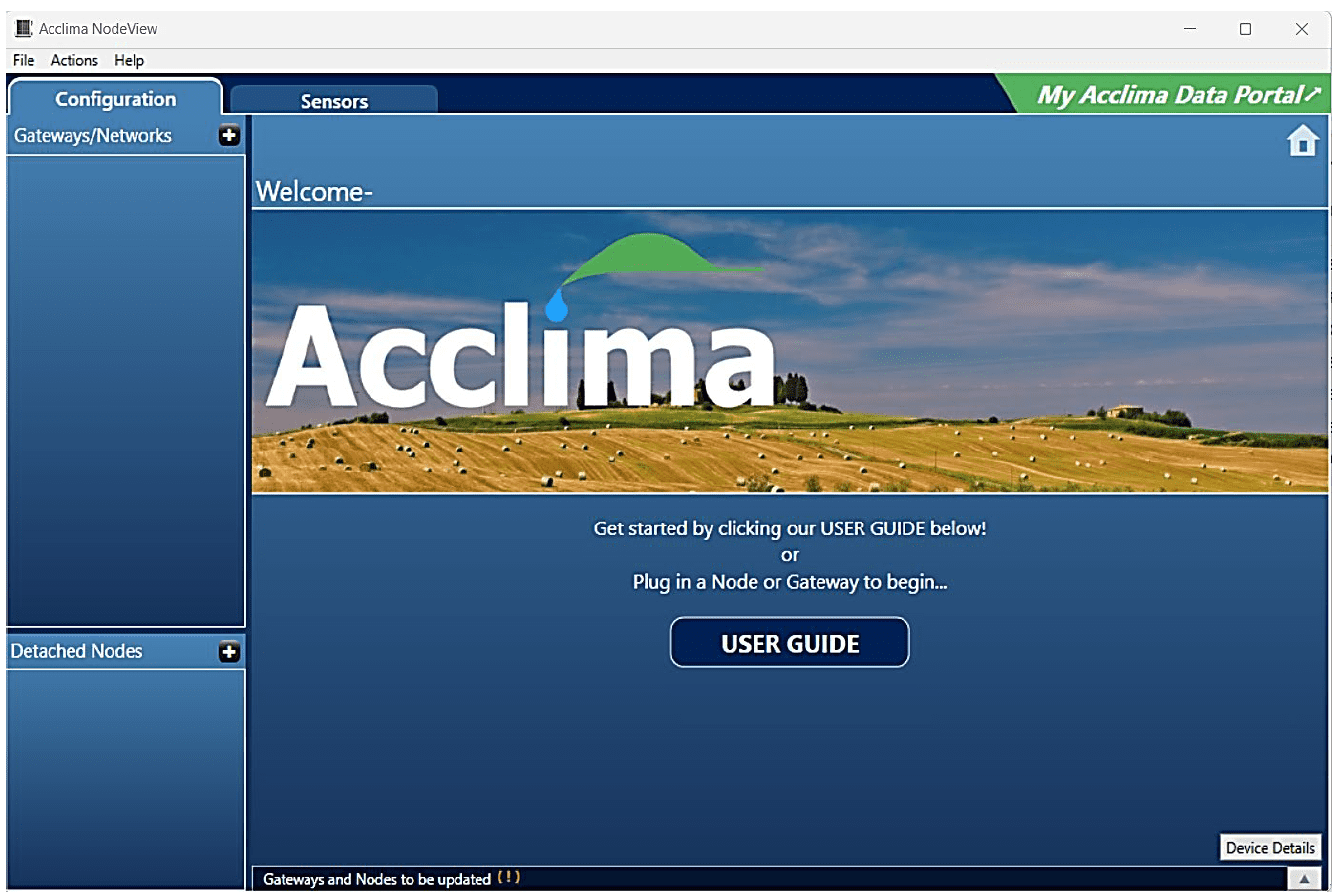
- With NodeView™ open you should see something like the following screenshot:
- Any devices that have been recognized and are actively communicating with the software will appear highlighted in white
 for Node, or
  for Gateway.
Note: The icon will be grayed if it is not communicating over USB.
a. If the Node is not listed, make sure the device is connected via a USB 2.0 A-B cable. Flip the power switch [On].
b. Hover the mouse over menus: Select; Actions >> Refresh Connections 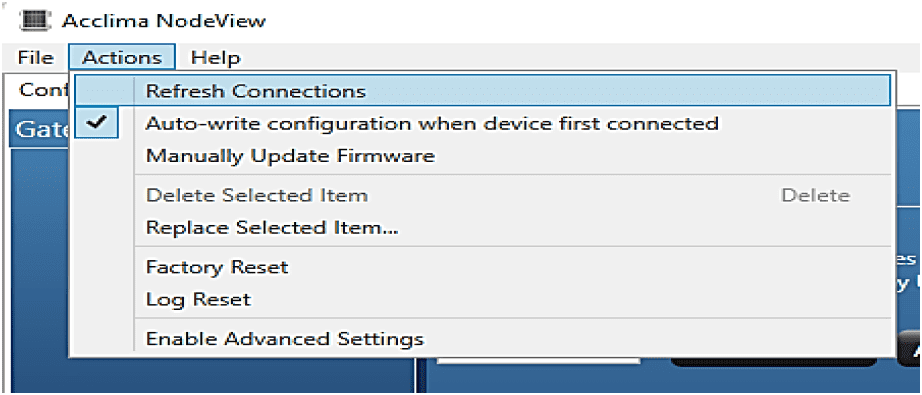
c. The device should now populate either in the ‘Detached Nodes’ or ‘Gateways/Networks’ section if it had been previously configured. 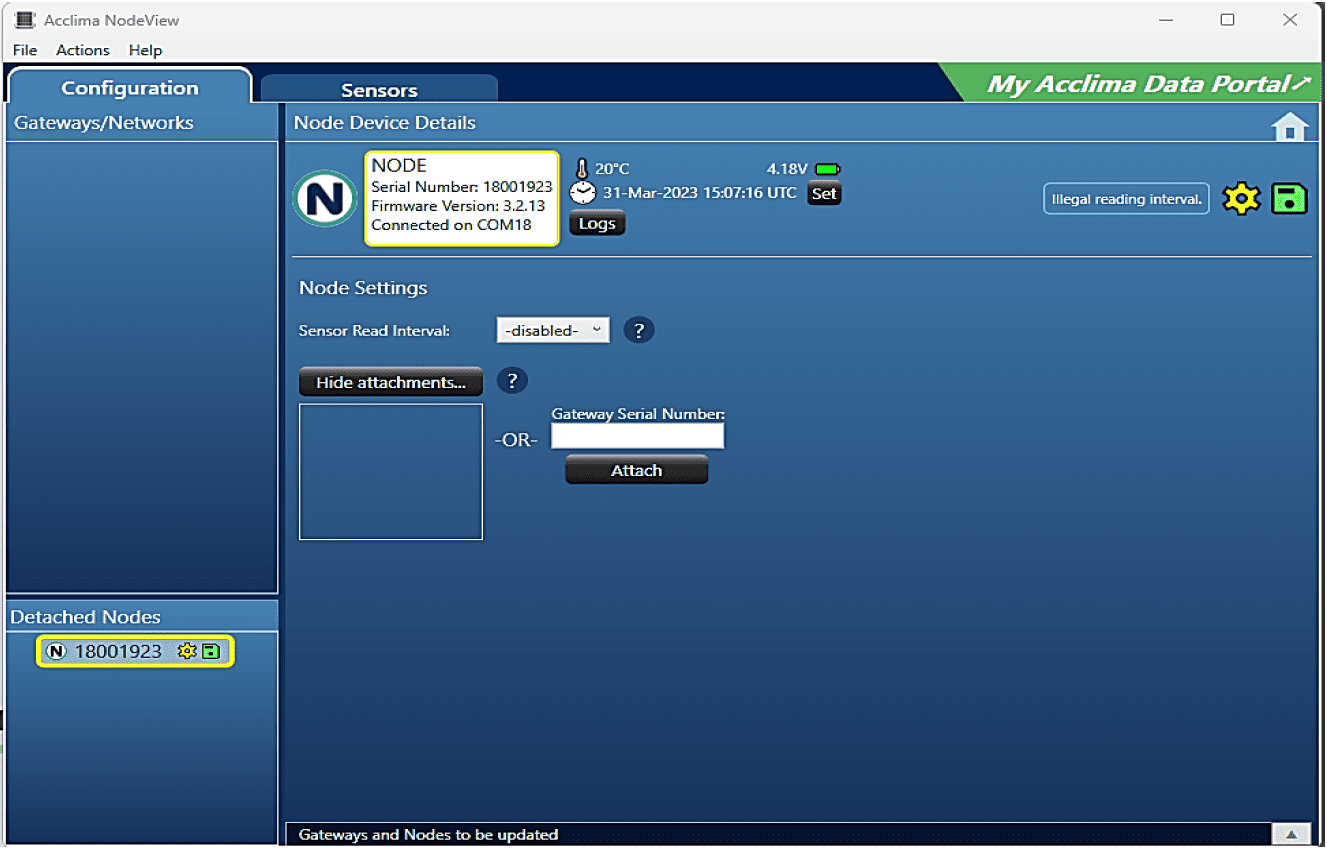
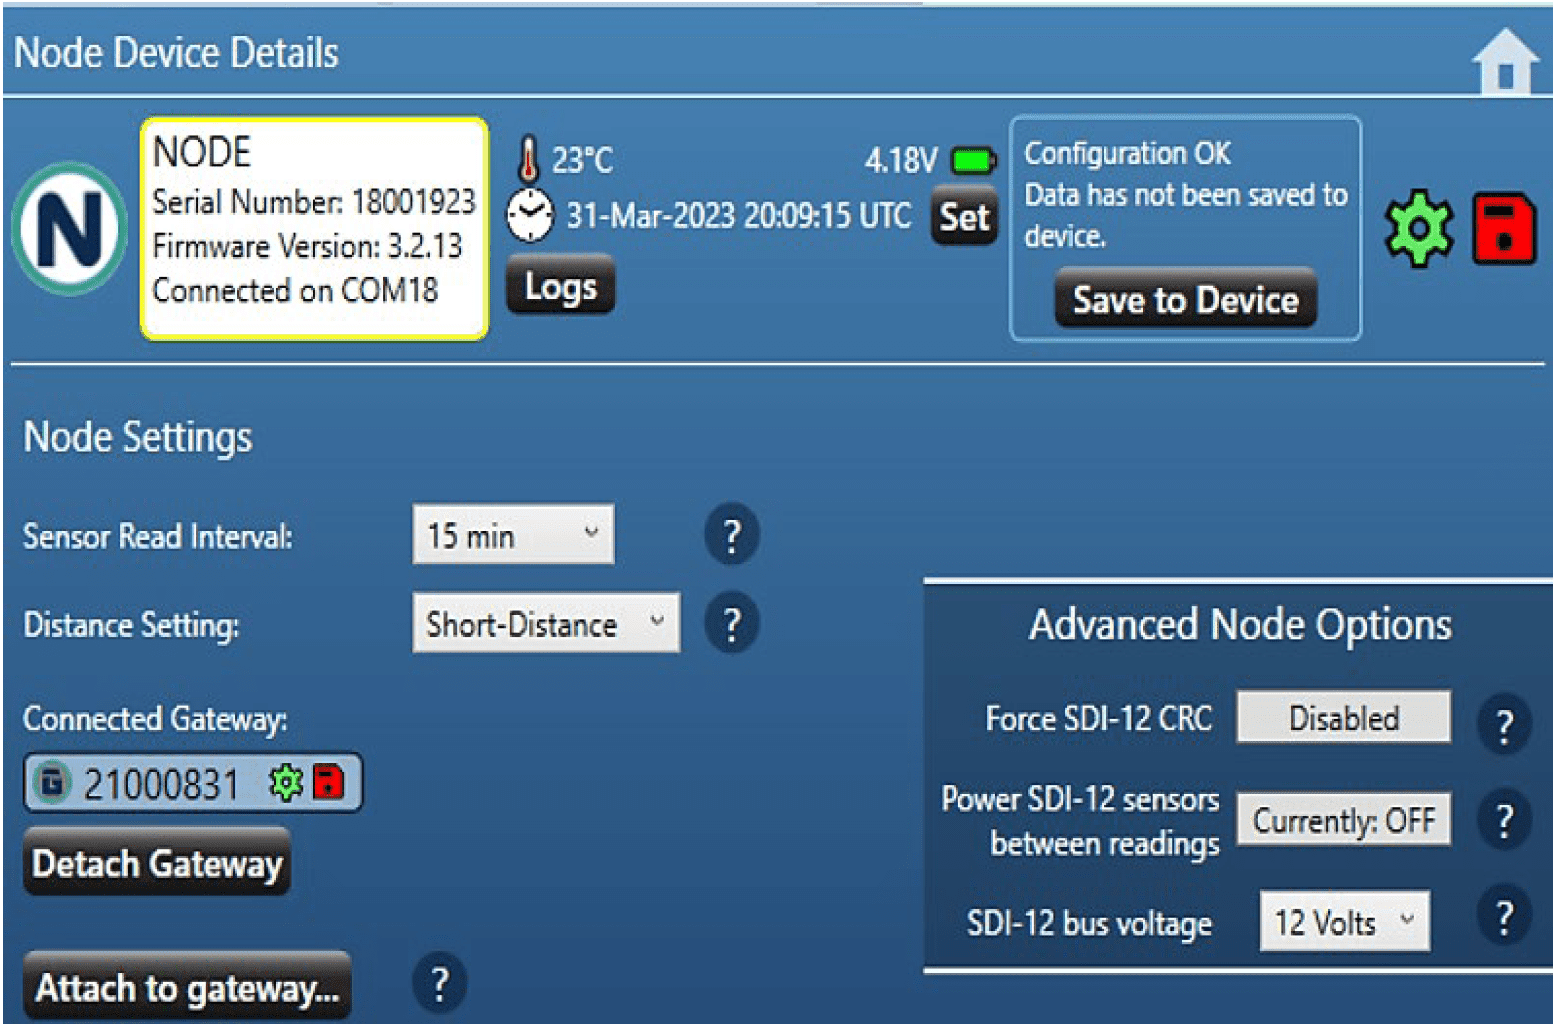
Node Setup
Configure a Node
Verify basic Node assembly is complete. The battery and the antenna are installed and connected to the device, the unit powers [On] and the Status LEDs show activity.
- Insert a USB A-B cable into the Acclima Solar Node and connect the other end to Windows PC.
- Windows drivers should automatically install or have been installed previously, and a ‘Com Port’ should be assigned in the background. See page (38).
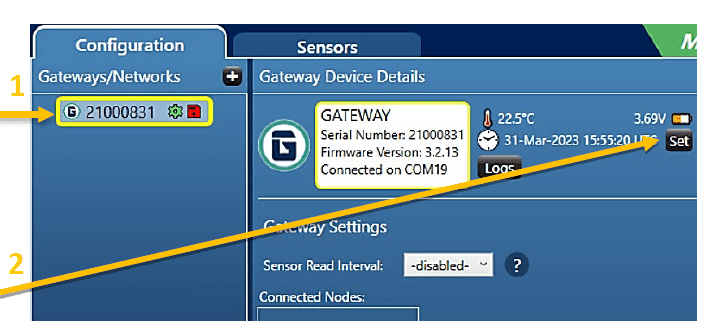
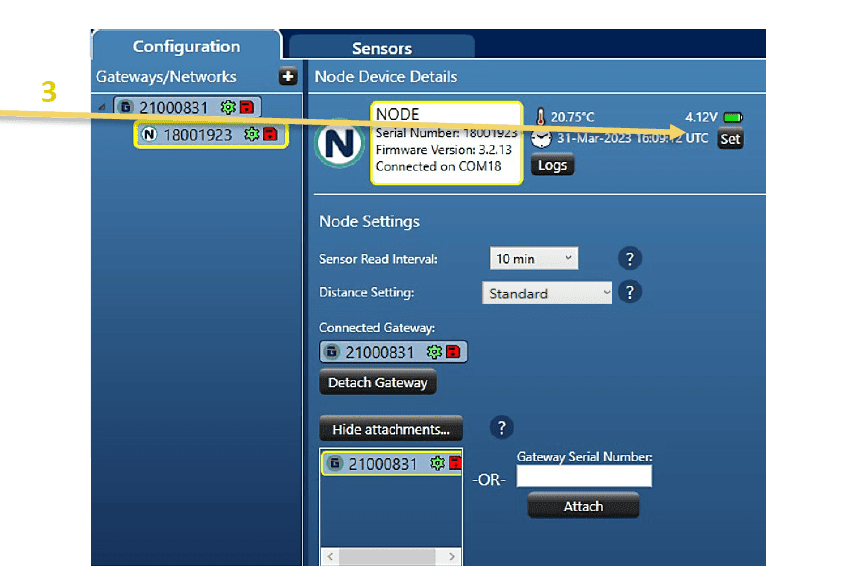
- The newly connected Node should appear in the ‘Detached Nodes’ section of NodeView. Alternatively, an already configured Node may appear in the ‘Gateway Networks’ section if it had been previously attached to a Gateway. Click the Node in the list so it is highlighted.
- Click the ‘Set’ button to synchronize the date and time with your PC settings.
- Choose the desired ‘Sensor Interval’ from as long as 24 hours, to as short as 10 minutes.
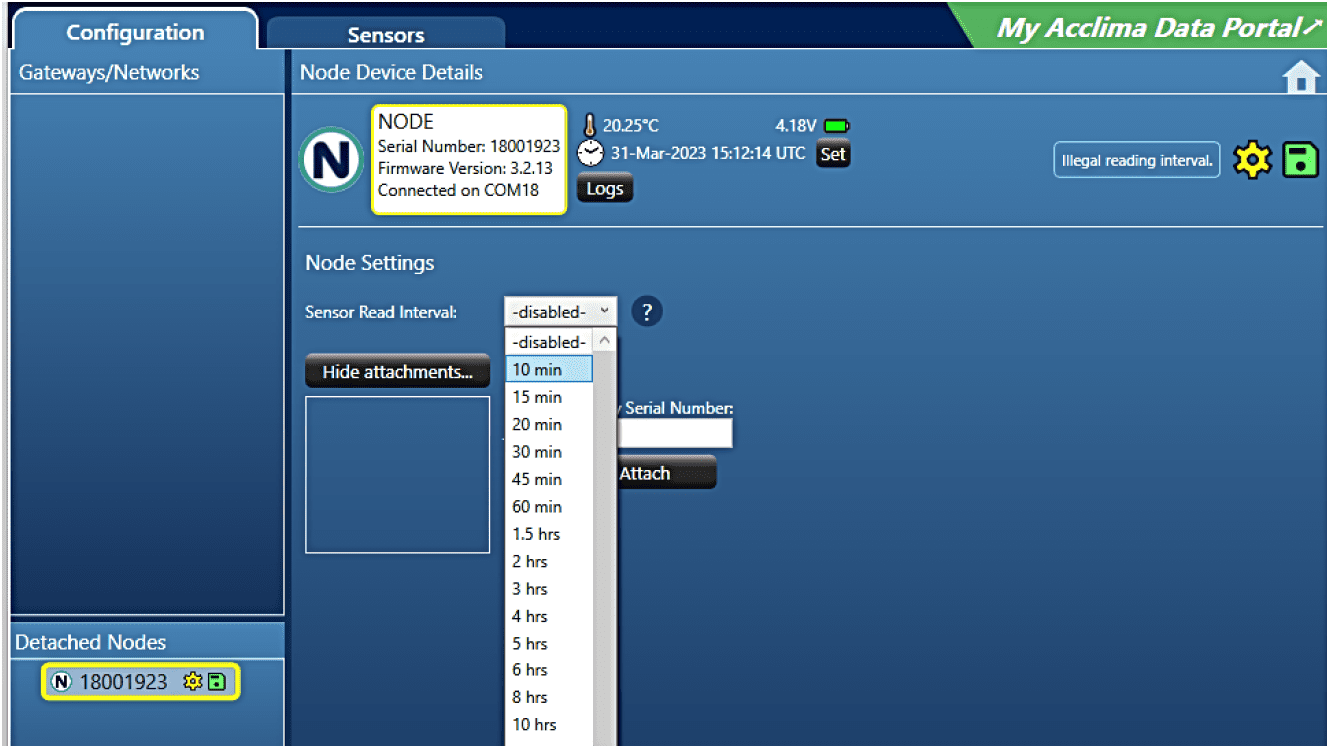
- Finally, save the configuration changes, by clicking “Save to Device.”
Note: The sensor interval is the time between recordings of internal sensors in the Solar Node and the connected SDI-12 Devices.
Addressing SDI-12 Sensors with a Node
The Acclima Solar Node can support data logging for ten individual SDI-12 devices. The user must manually identify each of these devices so that data logging can occur uninterrupted by errors caused by SDI-12 devices being too indistinguishable. The process of separating these SDI-12 devices is called “addressing”. Where a character is added to a device, to separate it from the other nine potential devices that can be connected to that Node.
How to Address an SDI-12 Sensor I
Note: Nodes can address multiple devices simultaneously, however, if the connected SDI devices share the same address, conflicts may occur that create parity errors. Addressing the sensors once at a time resolves these issues.
1. Open NodeView™ and navigate to the ‘Sensors’ tab.
2. Before setting the address, you may need to ‘Scan for Sensors’ to determine if your sensor is being detected by the Node.
a. Select a Node in the ‘Select Node’ list on the left. The correct Node needs to be highlighted in yellow to proceed with the process.
b. Plug in a terminated SDI-12 device into any SDI-12 port on the Node.
c. Click ‘Start Scan’ and wait for the process to finish. If the scan fails to detect the sensor, check the wires, and try the scan again. 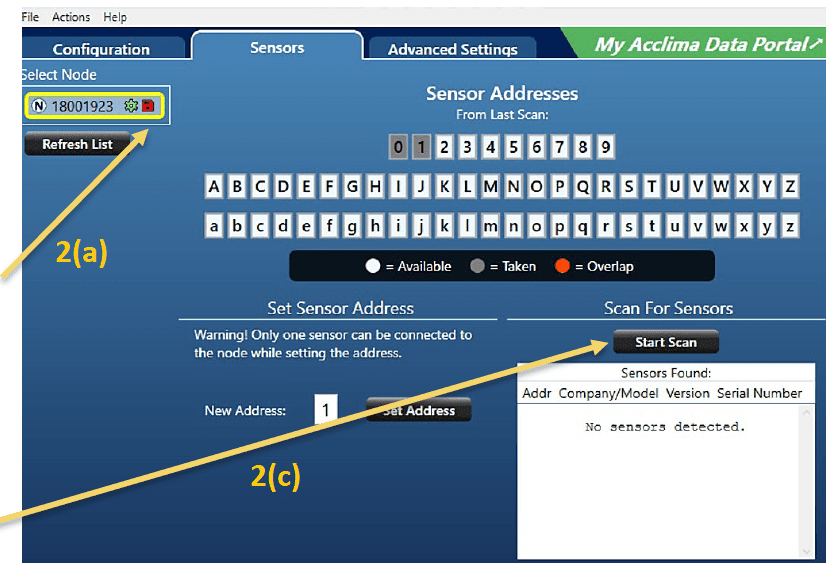
i. The scan may make several passes on the sensor to fully identify it.
ii. Once identified, the sensor may appear in the list in the order of Address, Company, Model, Version, and Serial Number. 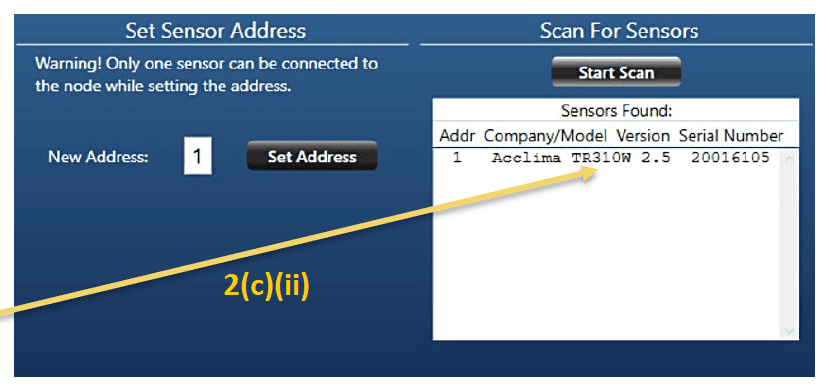
Note: If a scan does not return a sensor, verify the wires are terminated Red, White, and Blue per the Acclima SDI-12 wiring standard. Unplug the sensor and re-run the scan. If multiple sensors are not being detected unplug each and change each sensor address to a different address. The scan should show all individual sensors attached with unique addresses.
How to address an SDI-12 Sensor II
3. Once the scan has returned a sensor, you may use the ‘Set Address’ button to address the sensor accordingly.
a. Enter a value in the ‘New Address’ field. You may use only a single character per sensor, per address.
i. Numbers: [0 – 9]
ii. Letters: Capital [A – Z], or lowercase [a – z]
iii. We recommend using the same conventions per Node.
b. Use the ‘Scan for Sensors’ button to confirm that the address change was made. 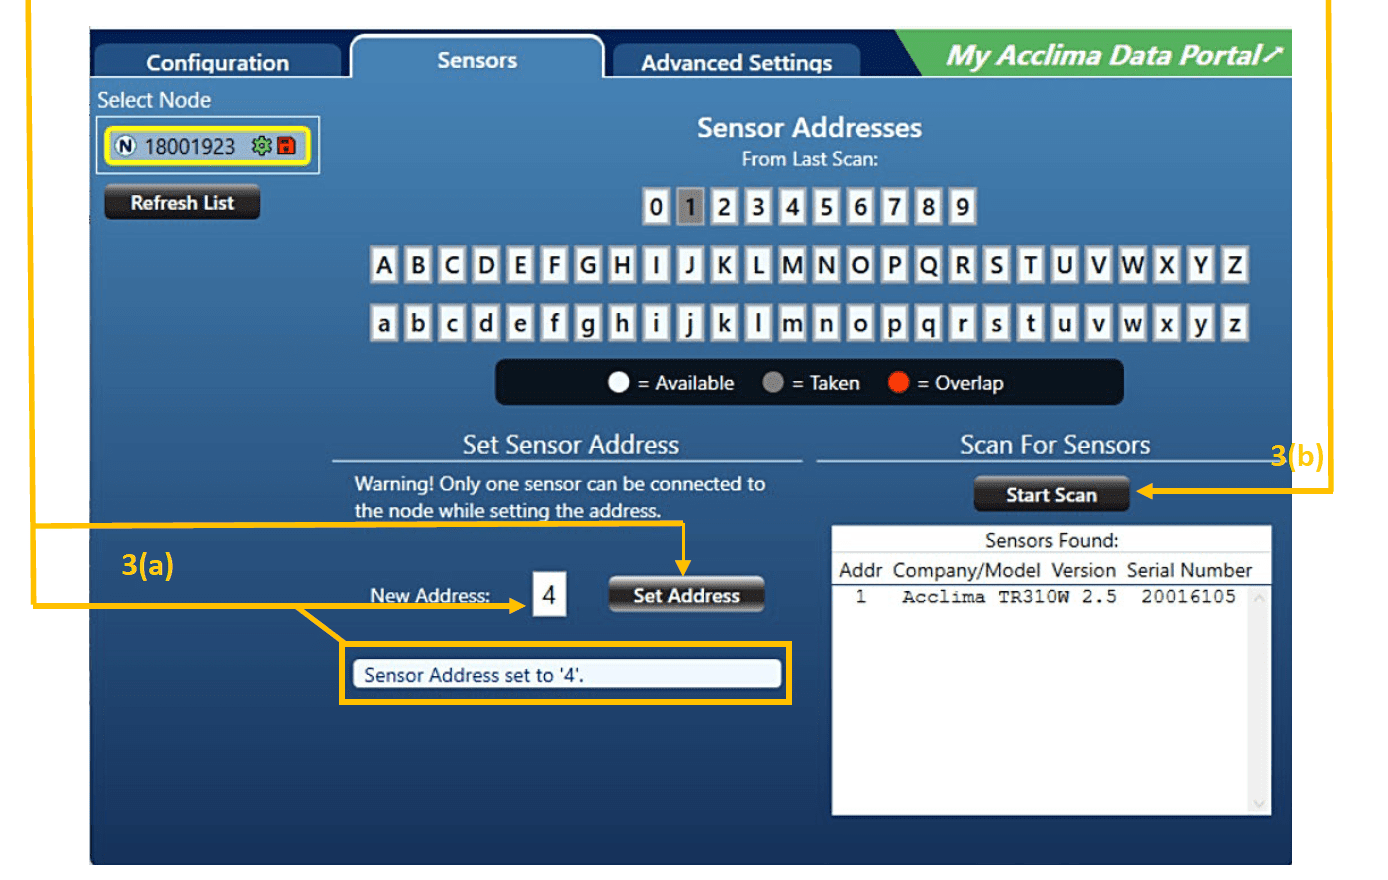
c. Repeat this process for up to ten sensors per Node.
Note: If there are overlapping sensors using the same address. This will cause data measurement problems for the Node. All sensors connected to the Node must have unique addresses.
Attaching a Node to a Gateway
At any time up to ten Nodes can be assigned to individual Gateways. The process of linking the Node to a Gateway is called “attaching”. When a Node has been attached to a Gateway, and the settings have been saved on both devices, a Gateway Network has been created. There are a few ways to attach Nodes to Gateways.
How to attach a Node Method I
[Begin with a Node]
- Locate the Gateway’s serial number that the Node will be attached to.
- Plug in the Solar Node via USB and select the Node so that it is highlighted in yellow.
- Click the “Attach to Gateway” button and enter the Gateway’s serial number into the Gateway Serial Number field and click ‘attach’. Your Node will appear to join the Gateway with that serial number in the Gateways/Networks section.
- Select the Node so that it is highlighted in yellow and click “Save to Device.”
- Disconnect the Node, then connect the Gateway via USB, select it, and click “Save to Device.”
- Verify both devices have been properly configured and saved. Repeat if needed.
How to attach a Node Method II
[Begin with a Gateway]
- Establish the serial numbers for each device to be in a Gateway Network.
• For example: 1 Gateway serial number and 10 Node serial numbers. - Plug in the Solar Gateway via USB and select it so that it is highlighted in yellow.
- Enter the Node serial number in the Node Serial Number field and click “attach.” The entered serial number will appear to join the connected Gateway in the Gateways/Networks section.
- Select the connected Gateway so that it is highlighted in yellow and click “Save to Device.”
- One at a time, plug in each Node with matching serial numbers in the Gateway Network and click “Save to Device.”
Note: If any mistakes are made during this process, you will need to delete the device from the configuration page. Select the erroneous entry so that it is highlighted, click the Actions button, then click “Delete Selected Item”, or press the ‘Delete’ key on your keyboard.
Gateway Setup
The Acclima Solar Gateway can receive data from up to ten Solar Nodes and forwards that data to the cloud via LTE cellular networks, where it is stored so that it can be retrieved and viewed by authorized parties.
- Open NodeView™ and connect a Gateway via USB, and turn the power [ON].
- Any devices that have been recognized and are actively communicating with the software will show up highlighted in white for Node, or for Gateway. Note: If the Gateway is not listed, make sure the device is connected via a USB 2.0 A-B cable. Flip the power switch [On].
- Hover the mouse over menus: Select; Actions >> Refresh Connections
- The Gateway should now populate in the ‘Gateways/Networks’ section.
- Hover the mouse over menus: Select; Actions >> Refresh Connections
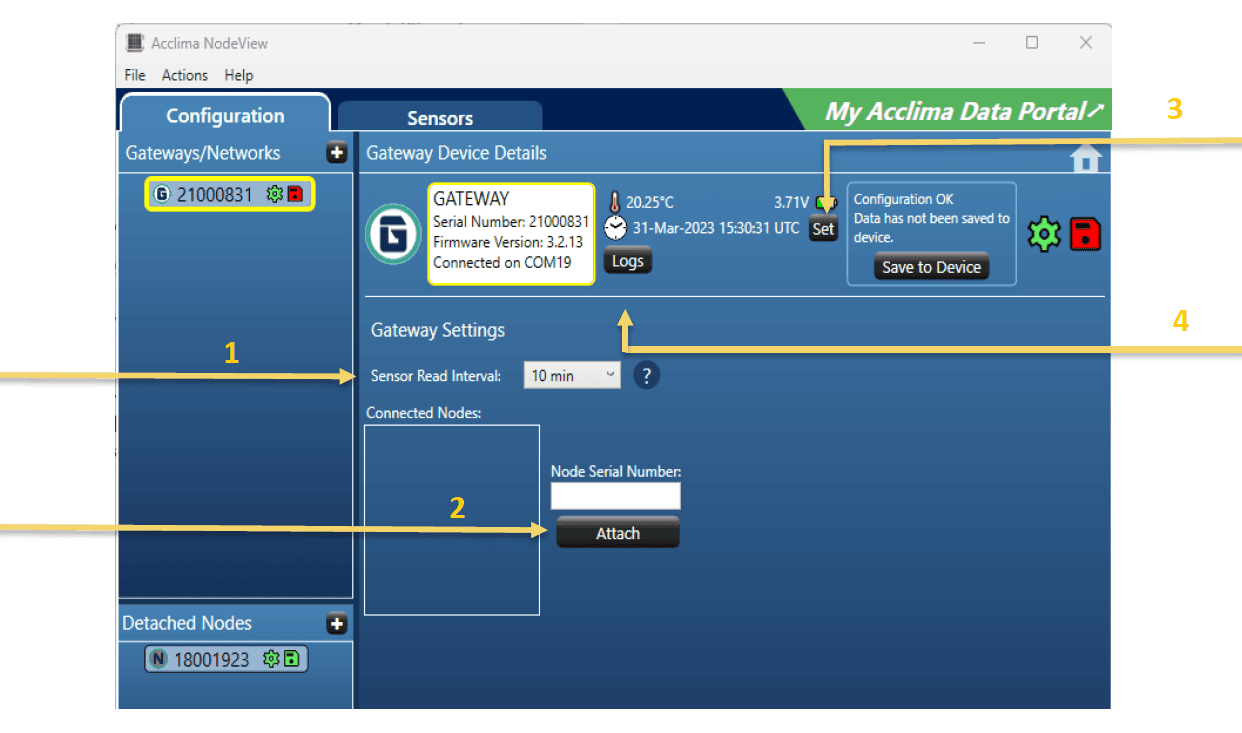
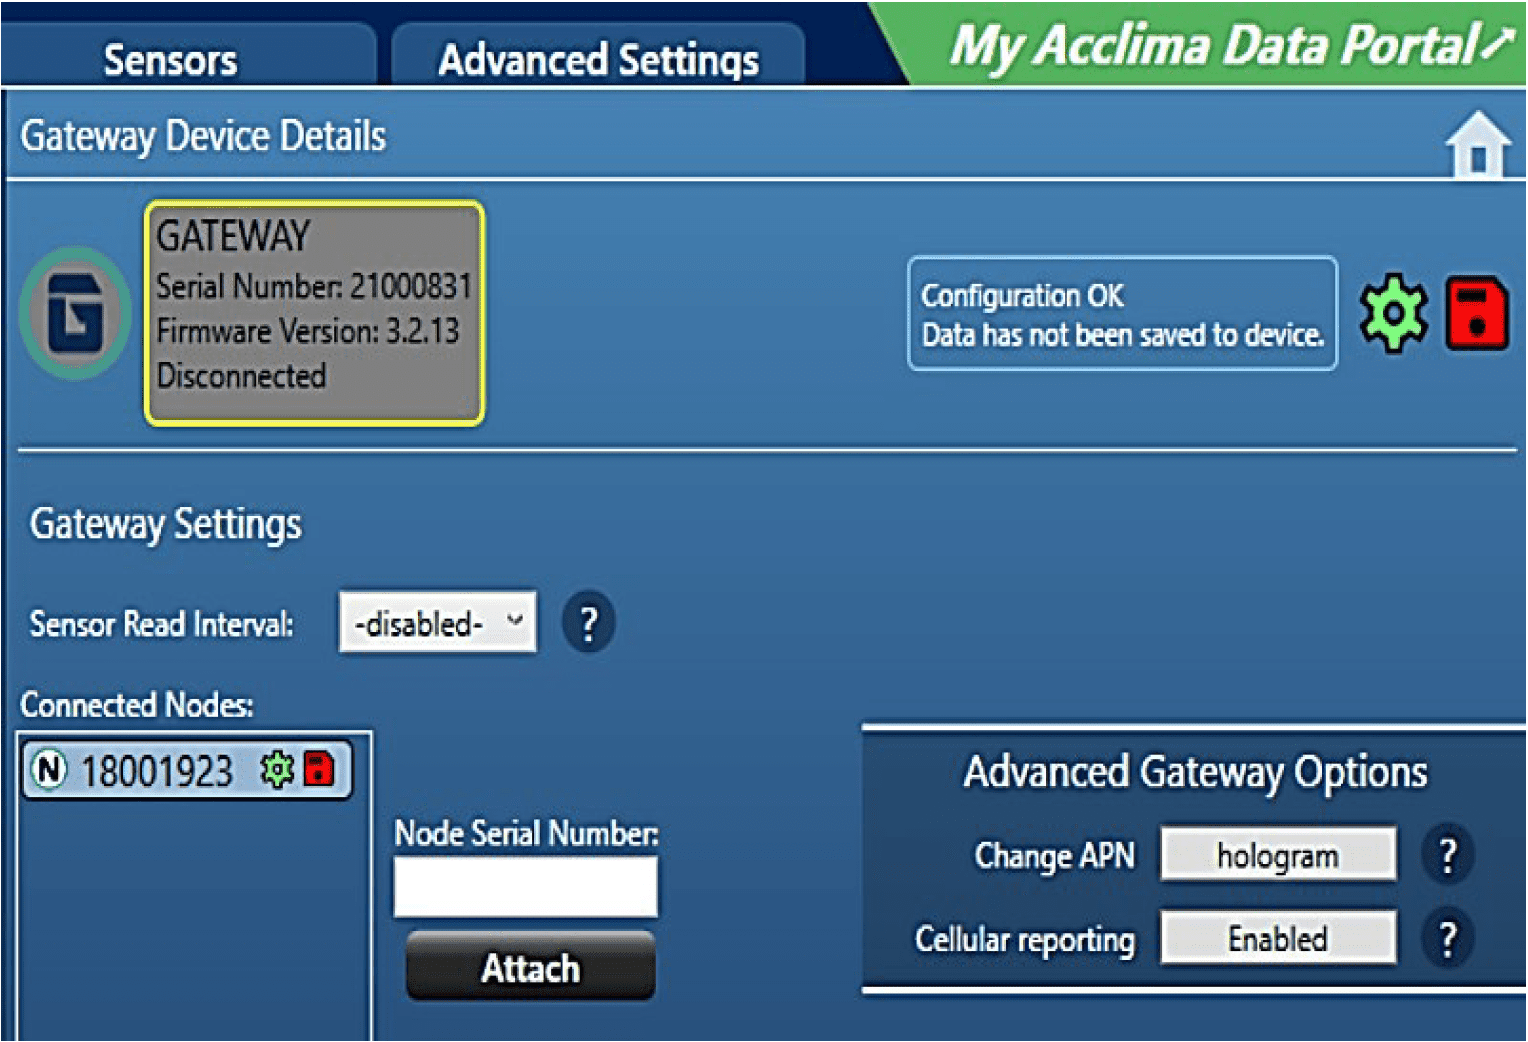
Gateway Configuration
In the configuration tab, you can change the settings of a Gateway. Select the Gateway so that it is highlighted in yellow. Change the settings to meet your preferred configuration.
- Sensor interval: The amount of time between the (internal) sensor readings of the Gateway.
- Both the Node and Gateway have 4 data points that are collected by internal sensors that indicate device status and environmental conditions: battery voltage, enclosure temperature, solar current, and solar voltage).
- Attach: You can attach serial numbers from Nodes that are connected/or disconnected by typing in their serial number in the ‘Node Serial Number’ field. Click ‘Attach’ to see it join the selected Gateway.
- Date/Time: Synchronizing the device “Date and Time” with the PC’s Universal Time Clock setting, can be performed by clicking the “Set” button found under device details.
- Logs: Can be retrieved directly from the Gateway’s internal storage by clicking the “Logs” button found under Gateway details. Logs are exported in a .CSV file format, compatible with Microsoft Excel-like software, both Nodes and Gateways support manual data extraction via this method. To retrieve the logs press ‘Help’, in the actions menu, then press “Open Logs Folder” where logs can be filtered and downloaded.
NOTE: After the configuration settings have been changed. Remember to save the configuration to the device. Click “Save to Device” to proceed to the next step.
Create a Node-Gateway Network
Finally, a network of Nodes and Gateways must be created to achieve device communication. Creating a Node-Gateway network lays the foundation for the automatic detection capability of the devices to take hold. Once the networks of Nodes and Gateways have been ‘saved’ successfully in NodeView™. The devices will start to send data within the parameters previously configured when they are all powered on.
How to Create a Node-Gateway Network I
After connecting your Gateway via USB.

- Verify that your Gateway is detected. Click the Gateway so that it is selected and highlighted in yellow.
- Confirm the date and time are accurate, click the “Set” button to synchronize the date and time with the computer’s clock. Note: “Set” synchronization “Logs” and “device details” are only accessible when connected via USB.
- Select the desired “Sensor Interval.” Use the pull-down menu to select a preferred sensor interval time.
- Enter the desired Node’s serial number and click “Attach.”
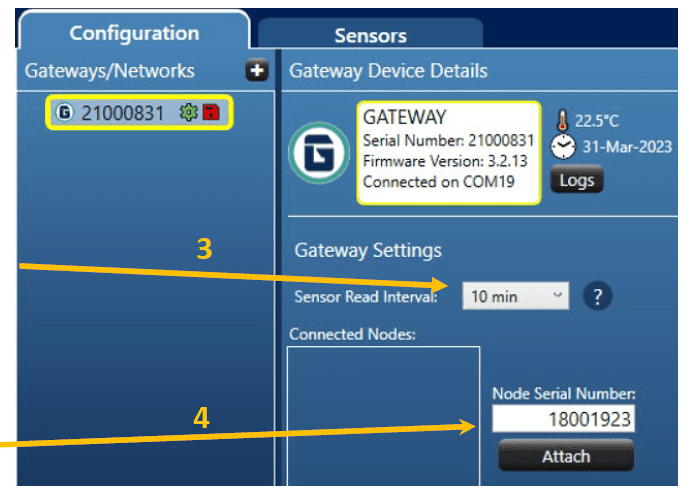
- With the Node “Attached,” select the Node so that it is highlighted and then adjust the “Radio Range.”
Note: Once the Node has been added, you can save the Gateway configuration. Newly attached devices will need to be plugged in and highlighted so their configurations can be saved.
How to Create a Node-Gateway Network II
To complete the connection, the Node must now be configured.
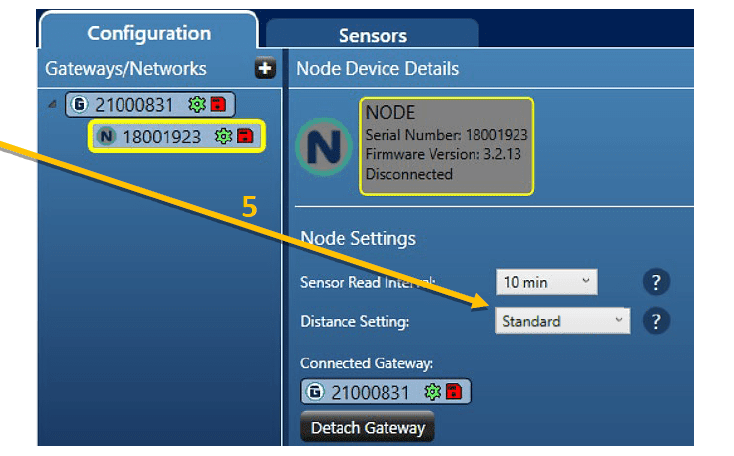
- Select the newly added “Node” under the “Gateway/Networks” section to proceed with the pairing process.
- Connect the USB cable between the newly added Node and the PC. The Node should illuminate its symbol and change from gray to white; make sure to select it so that the Node is highlighted in yellow around the edges.
- Configure the Node and click “Set” to synchronize the date and time with the computer’s clock settings.
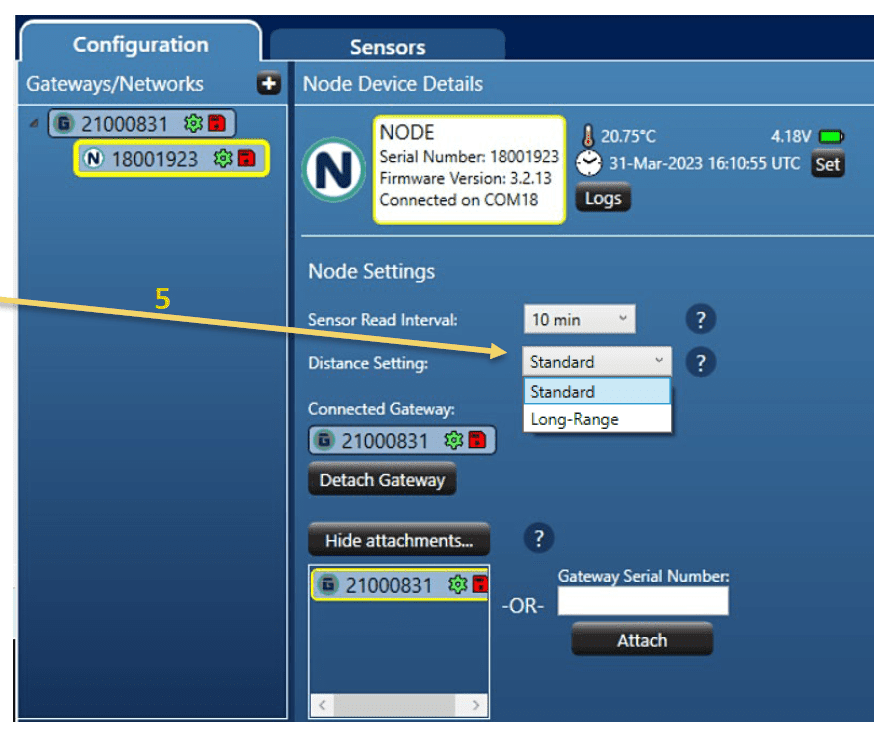
- Select the desired “Sensor Interval.” Use the pull-down menu to select a preferred sensor interval time. Note: Standard range mode, uses fast data communication at high efficiency. Standard range is best if used within 1-2 miles, with low obstructions to the line of sight. Long-range mode, utilizes slower data communication, and redundant retry attempts to pair Nodes and Gateways at long distances. Best if used within 3-5 miles, and with little or no obstructions to line-of-sight.
- Select the desired “Range Setting” mode.
- Finally click “Save to Device.”
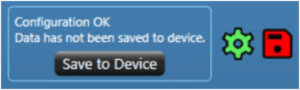
Note: After functional settings have been changed and saved, the red “floppy disk” icon will change to Green.
![]()
Note: Repeat this process to add up to 10 Nodes to a Gateway/Network.
After the Node/Gateway Networks have been created you can keep the devices running and verify system functionality in the Acclima Data Portal pages . Once functionality has been confirmed, you may gather all hardware needed to install the units in the field.
Confirming the Network is Ready for Installation
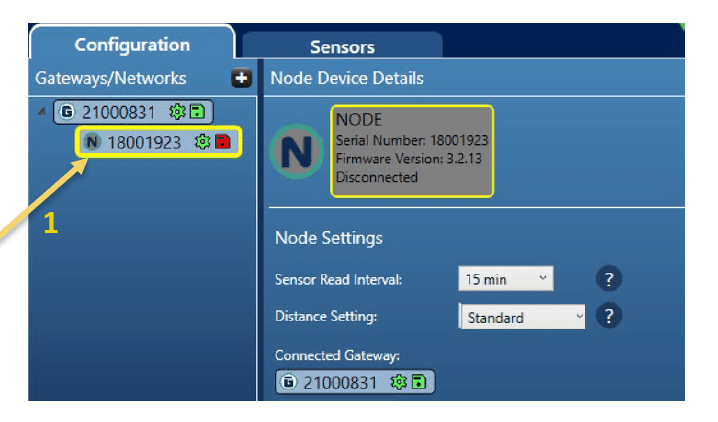
After making the desired changes to the configuration settings of the Gateway and Nodes. You must confirm that all hardware in the “Gateways/Networks” list are communicating as previously setup. This is indicated by the status symbol to the right of the serial number of a device.
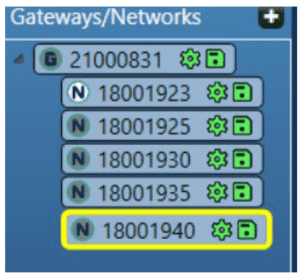
All Nodes paired with a Gateway need to display green gears and green floppy disks.
Configuration OK/Ready: This is determined when all Nodes are joined together with the parent Gateway. Visually indicated by all solid green ‘gear’ and green ‘floppy disk’ icons.
Network Will Not Communicate: This occurs if any device in a network has illegal settings or settings that have not been properly saved to the device.
Note: A device will not save unless it is ‘connected by USB’ and ‘selected.’ This is indicated by the white background of the N or G image and highlighted in a yellow outline.
Configuration Status Color Key
Yellow

Yellow Gear: An illegal setting has been selected.
- Fix – Change functional settings like ‘Sensor Interval’ and [Save to Device].
Green

Green Gear: Chosen configuration settings are functional and ready to use.
- Device Ready!
Green
![]()
Green Floppy: Configuration changes have been saved to the device.
- Settings Saved!
Red
![]()
Red Floppy: Configuration Changes are Unsaved.
- Fix – Select the device and click [Save to Device].
Menu Actions and Behaviors
Menu I
File
Archive Configuration Data – Creates a portable .cfg that contains all stored configuration data.
Restore Configuration Data – Imports a previously exported configuration profile in .cfg format.
Delete All Configuration Data – Clears currently active configuration data from NodeView.
Note: Does not affect device configurations for Nodes or Gateways not connected at the time of deletion.
Exit Without Save – Closes Application
Exit (default) – Closes application and saves most recent changes (does not save to device).
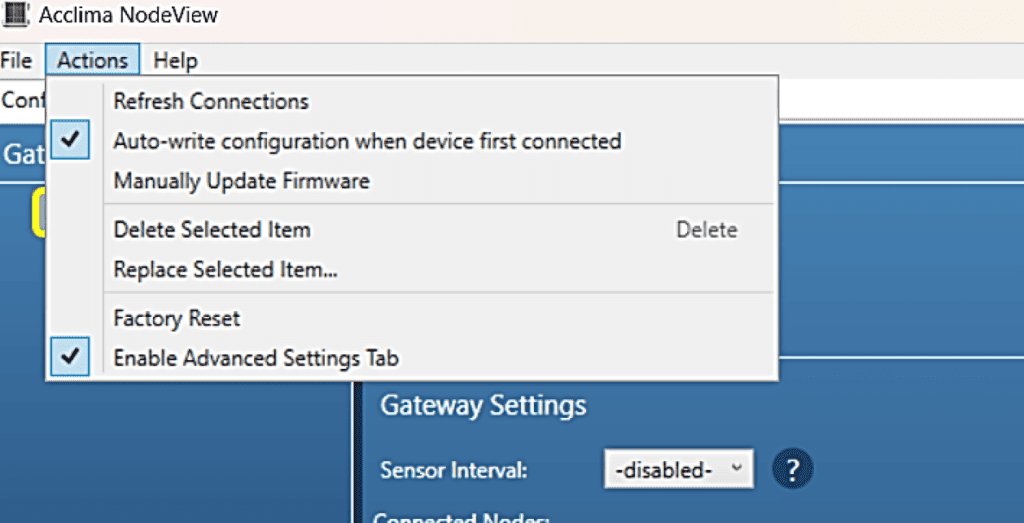
Actions
Refresh Connections – Rescans ports to detect connected hardware.
Manually Update Firmware – Select a previously downloaded update file to upgrade Node/Gateway firmware. Can be found at Acclima.com or by contacting Acclima support.
Delete Selected item – Click an item to be removed from view, the ‘Delete Key’ provides the same functionality.
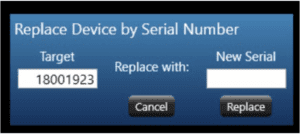
Replace a Selected item – Change a target’s “serial number” to a “new serial.” Associates all devices attached with the “original serial” to the “new serial” number.
Menu II
Actions
Factory Reset – Attempts to reset a selected device to factory default settings. It does not erase log files.
Enable Advanced Settings – Unhides the “Advanced Settings” Tab and enables certain features previously “hidden” to be “unhidden” at the user’s behest.
Help
User Manual – A link to this guide can be found at any time.
User Guide – A tutorial of NodeView and its functionality can be found at the home screen for use at any time. Click the home icon located at the top right of the page to be brought to the User Guide button. Clicking the User Guide opens a second window where a tutorial is made available.
Open Updates Folder – Opens the folder on the PC where Node/Gateway updates are kept.
Behaviors
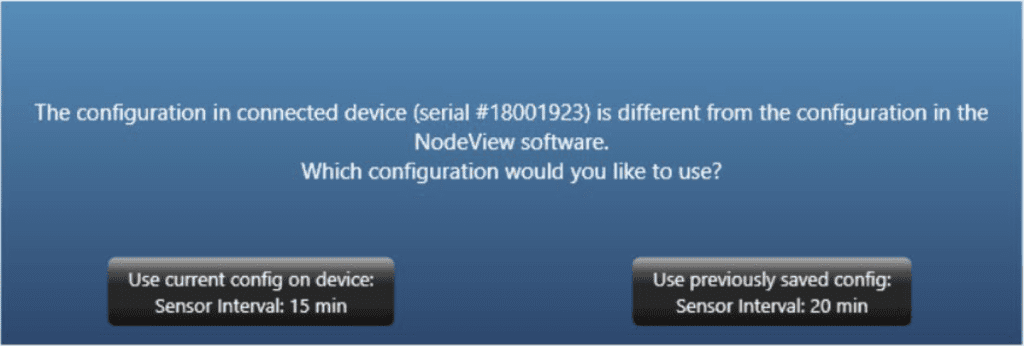
Different Configurations
After a Node or Gateway has been configured. The changes that are made are saved in NodeView and on the device. When these settings appear to be different, NodeView will ask which setting you prefer to use. The “Device Settings” on the left or the “NodeView Settings” on the right. The user must select one to proceed.
USB Connect/Disconnect
After a Node or Gateway has been updated. The update window will need to be closed so that the USB device can be shown as active within NodeView. Similarly, after a Gateway network has been created, all devices will need to have the USB disconnected to continue the pairing, LoRa and Cellular communications process.
Advanced Settings I
To modify Advanced Settings, click “Actions” and then click “Enable Advanced Settings.” Doing so exposes hidden features that are user modifiable.
Click the new “Advanced Settings” tab, to view and unhide the advanced setting options. Once the advanced settings are unhidden, they can be found within their respective options.
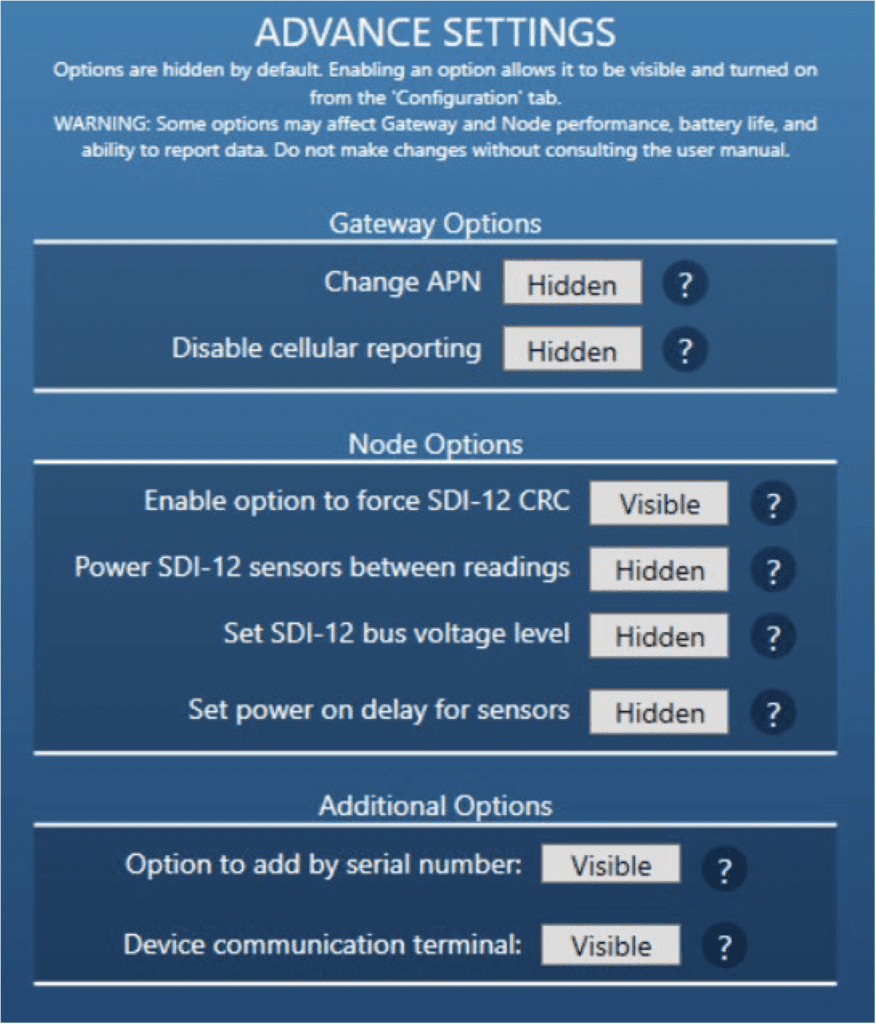
Note: Changes made in Advanced Settings can result in system instability leading to data loss.
Advanced Settings II
Change APN
APN or Access Point Name is a network identifier that points to an external network for the Gateway to connect to. When entering a new APN, make sure to enter the details correctly.
Cellular Reporting
Enabled by default, the user can elect to disable cellular reporting. Which ceases the functionality of the Gateway cellular modules. This changes the Gateway into a manual data-gathering hub for users where cell networks are unavailable.
Force SDI-12 CRC
This option enables visibility for Cycling Redundancy Checking. Enabling this feature enhances error-checking and correcting capability at a reduction in the speed of data transmission.
Power SDI-12 Between Readings
Disabled by default, enabling this setting allows connected SDI-12 devices to remain powered on. This improves overall system performance with a small hit to battery. Battery life becomes more impacted as the number of sensors increases.
SDI-12 Bus Voltage
Solar Nodes will support sensors with voltages as low as 7v. However, 12v is the standard for SDI-12 devices. Using this setting may add system instability if SDI devices are added together that operate at different voltages.
Enable Device Reports
Debugging tool (DNF)
Advanced Settings III
Bulk Serial Number Attachments
The option to add by Serial Number is disabled by default. Enabling it exposes two new identical buttons in the form of a ![]() plus icon. Both buttons perform the same function.
plus icon. Both buttons perform the same function.
![]()
Once activated a screen appears that allows Nodes and Gateways to be added into the Detached Nodes and Gateway/Networks one after another. This allows many serial numbers to be entered prior to the units being plugged in via a USB cable. If careful consideration is applied, the user can pre-configure multiple networks beforehand and then return later to connect the devices via USB to save the changes to the configuration settings. This can save time, but errors can cause tedious headaches.
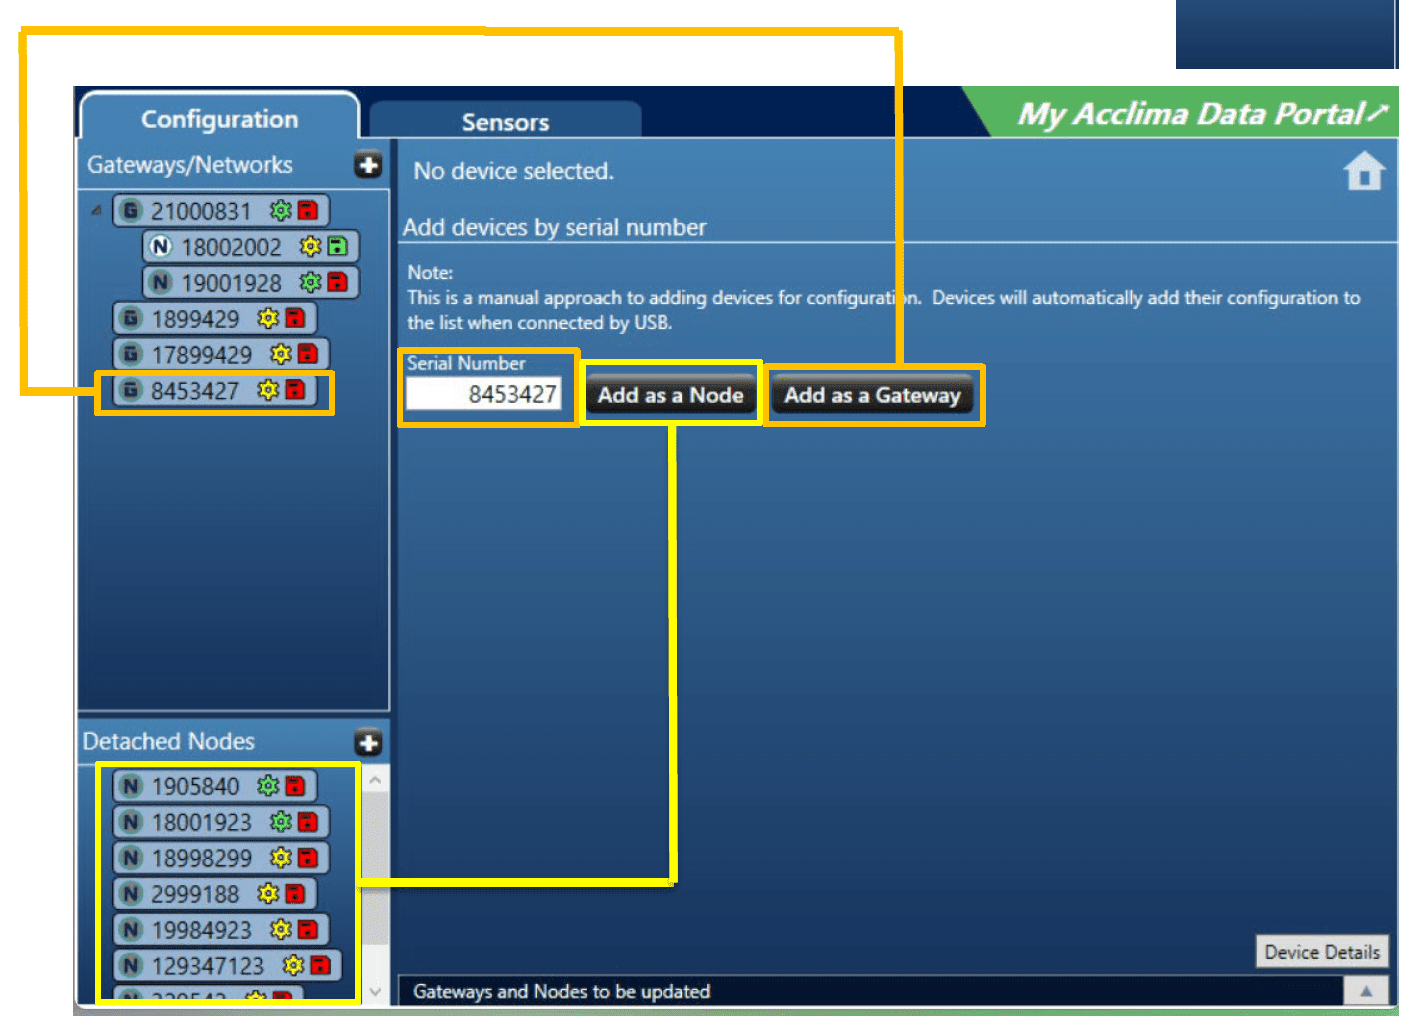
Note: This is an advanced option because of the issues that may arise due to incorrect entries. We recommend creating one Gateway Network at a time.
Acclima Data Portal
User Account Creation
A user account can be created at any time.

Create a User Account
- Visit data.acclima.com
- Click the link “Create New Login.”
- Enter a preferred name, email and password in the fields
- A message will be sent to that email with instructions to verify the account information.
Note: The password must be at least twelve characters long.
User Registration Email
- Find the email sent by dev@acclima.com.
- Click the email verification link, before its expiration in six (6) days.
- The link will redirect you to complete the account claiming process.
Claiming Account Devices
After account creation you will need to link your devices to your User Account. Sales representatives from Acclima will have sent a link with an ‘Account ID’ and ‘PIN.’ These unique identifiers allow you to join your ‘User Account’ with ‘Devices’ you have purchased.
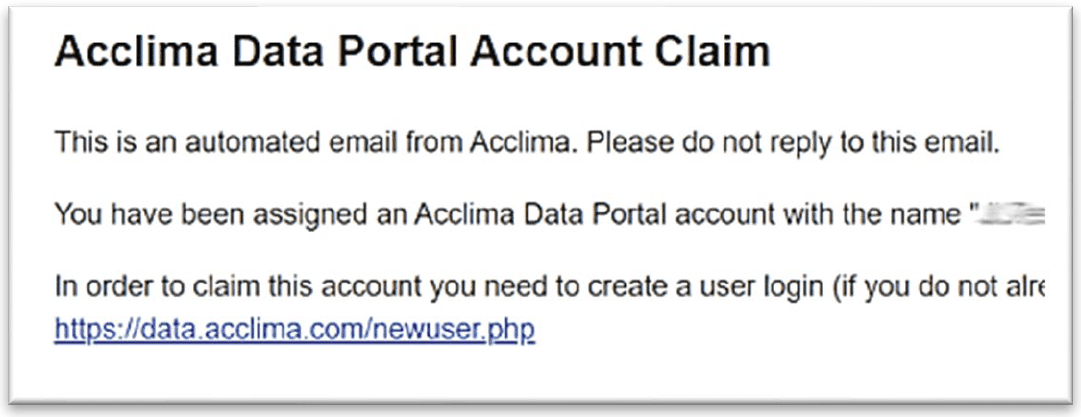
- Find the email that was sent after purchase titled, “Acclima Data Portal Account Claim.”
- Copy the “Account ID” and “PIN” from the email.
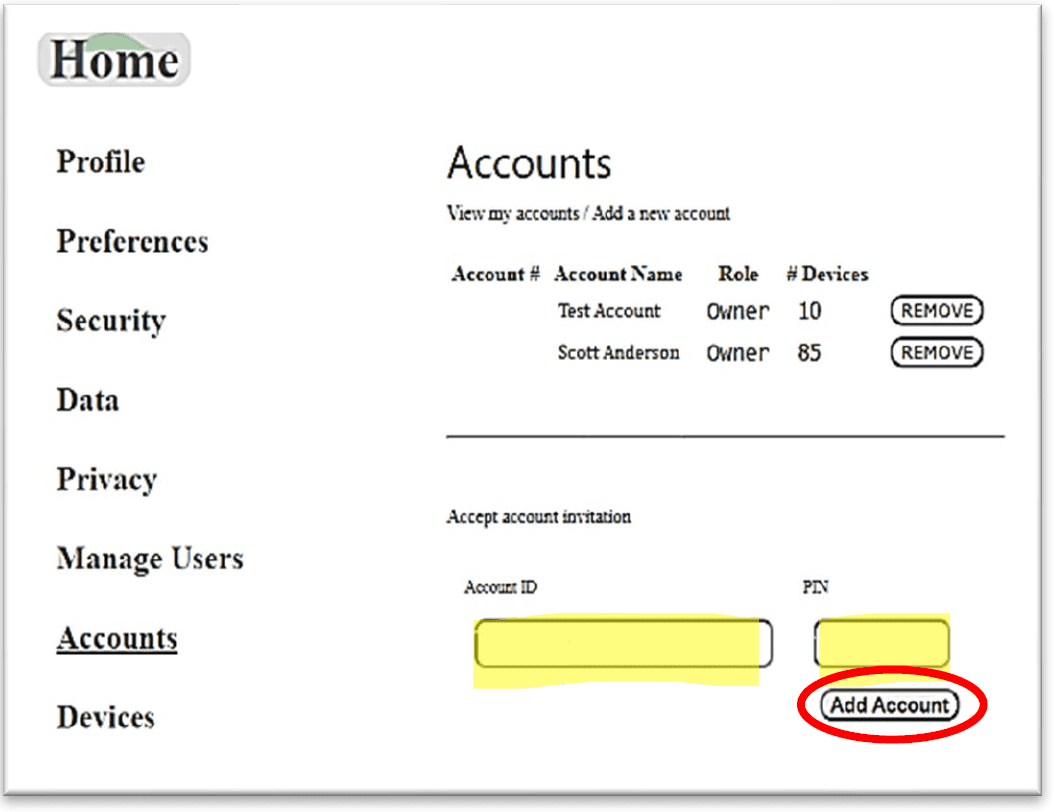
- Return to the data.acclima.com portal. Click the User Menu in the Acclima Data Portal and click “Settings,” and navigate to “Accounts.”
- Paste the Account ID and PIN numbers into the respective fields.
- Click “Add Account.”
Note: Once complete, “Account Added” will appear in red and purchased Acclima Gateways will now be visible on the dashboard section in the home page.
Note: Similarly, a user can be granted access to an account per invitation from
an “Account Owner.” The User will need to accept the invitation from the home
screen or in the User Settings Menu.
Adding Users/Modifying User Permissions
After claiming your devices, the role of the account defaults to the position of “Owner.” The owner has complete authority over the account and can invite others to join the account with permissions selected by the owner. The owner may invite a user to become an “observer”, a “manager”, the owner can even invite another “owner.”
How to invite a user to view or manage the Account
- Click the “Options” button, found behind the silhouette icon in the top right.
- Click “Manage Users.”
- Click the button for “Add New Users for Account Name.”
- Type the email address for the person you wish to add.
- Select the role and click “Add User.”
If the target user has already created an Acclima Data Portal profile using the same email the invitation was sent to, they will automatically have access to the data on the account. If the email you have sent the invitation to is not associated with an Acclima profile. Once a profile is created with the same email address, they will be greeted with the account data at sign in.
Acclima Data Portal II
Account Settings
- Profile – You can modify your Name into a Nickname or other moniker. To better help identify the profile.
- Security – You can change your password, which requires twelve characters.
- Data – You can process data from the Gateway attached to an account. This data is converted into a .CSV file. That can be imported into Microsoft Excel.
- Privacy – Data Sharing is Opt-out by default. It can be changed by selecting Opt-In.
Note: We do not sell data to third parties under any circumstance.
- Manage Users – You can add new users via email invitation to your account and provide certain permissions.
i. Owner: Owns the account and has full control over data and data access permissions.
ii. Manager: Has control over data and some access permissions.
iii. Observer: Can view data with no control over permissions. - Accounts – View account information including the number of Node and Gateway devices.
Acclima Data Portal and Gateway Sync
After your Nodes have been assembled, configured, saved, and networked with a Gateway, then disconnected from USB, they should automatically pick one another up and start sending readings to your Acclima Cloud Data portal within 30-minute intervals. To view the live readings, visit data.acclima.com and click “Home.” If no cellular synchronization has occurred, only the Gateways will be visible but without measurement or system health data.
Note: Sim Card must be activated with a current subscription to Acclima Cloud
Services to view data being sent by Acclima Nodes and Gateways.
Note: Acclima Cloud data access ceases once the subscription has expired. Data
must be manually gathered from Nodes and Gateways.
Note: Cloud service is restored for 12 months when the subscription is renewed.
Acclima Data Portal III
Dashboard Layout
- Home
- Quick Links
- Settings
- Account
- Body
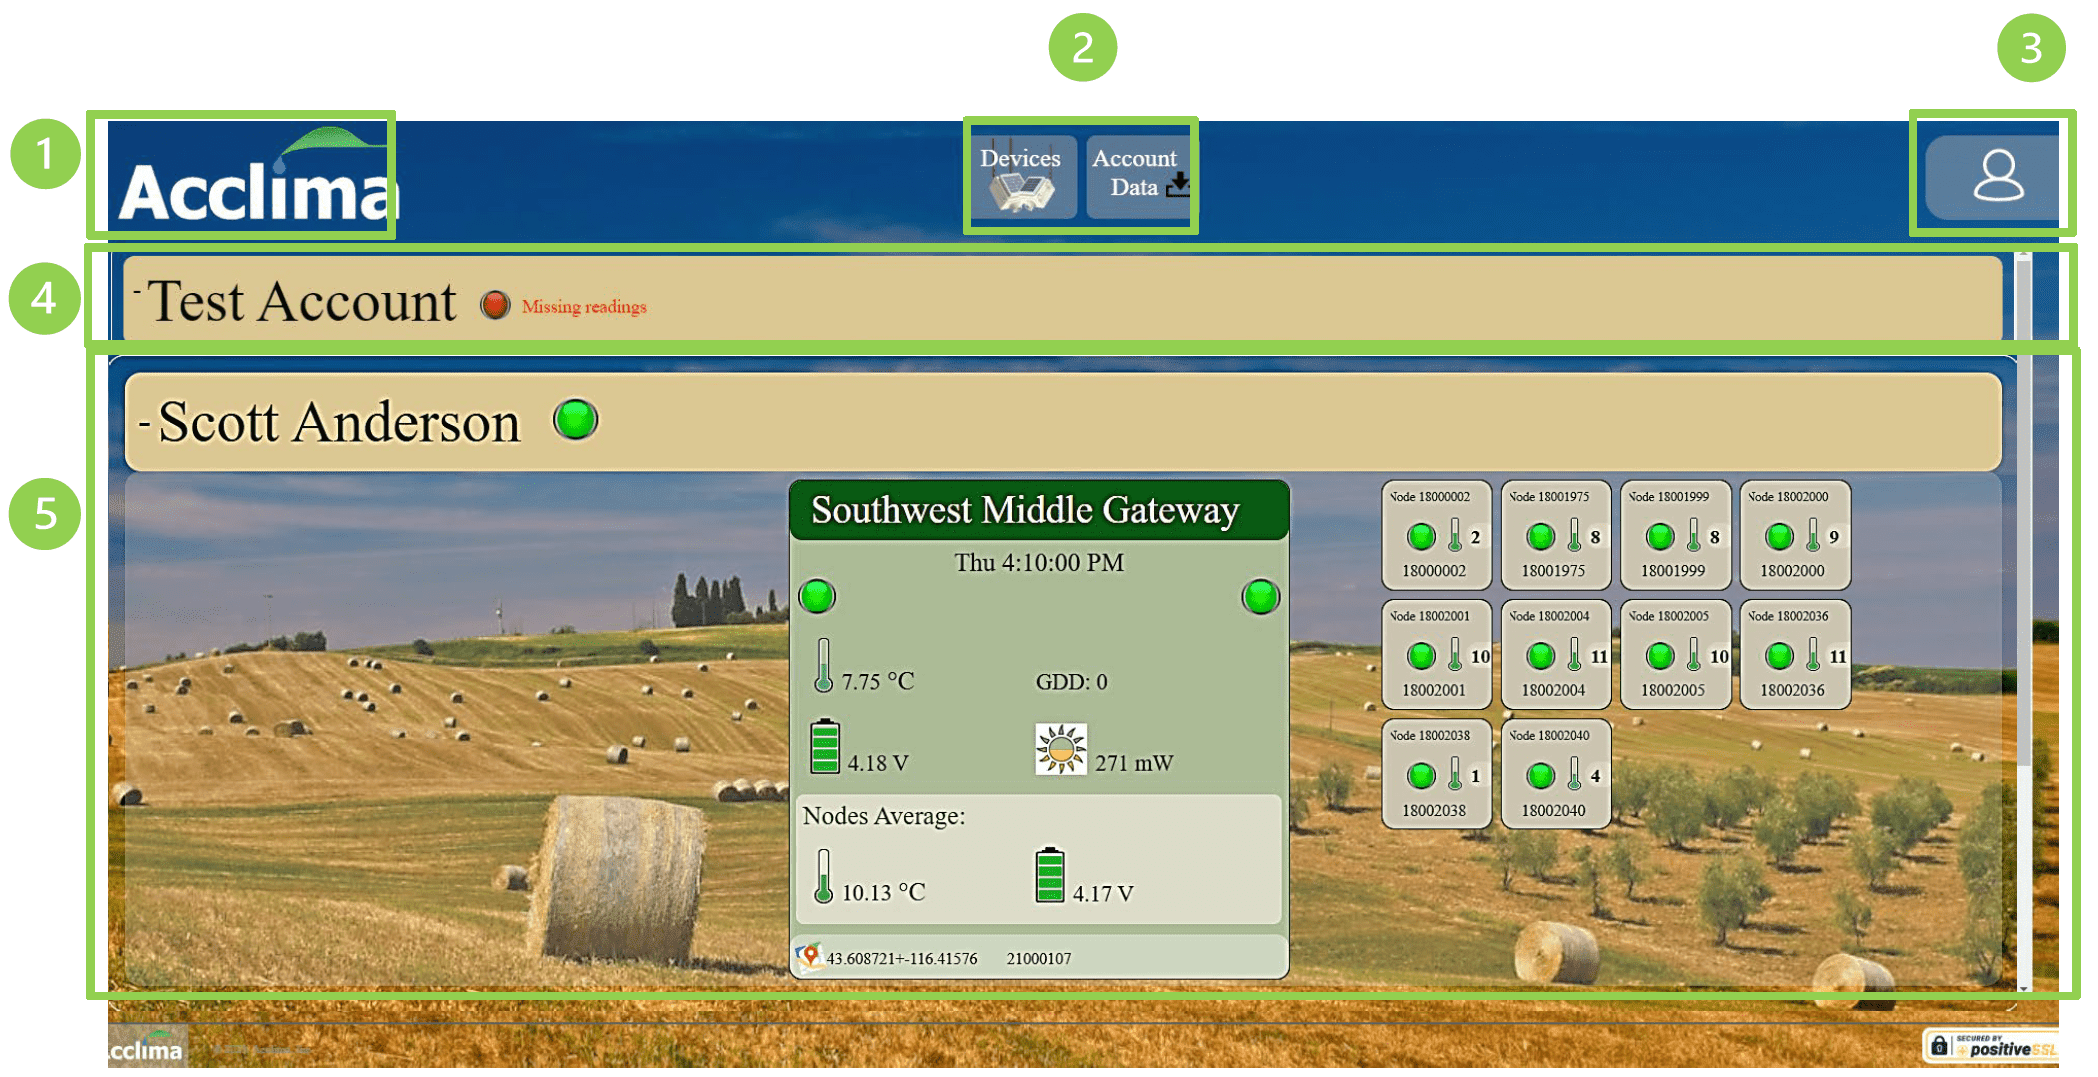
Home – Shortcut back to the homepage.
Quick Links – Shortcuts to Devices, Data, and Groups and Maps.
Settings – Shortcut to Account configuration and details.
Account – Collapsible, shows current account, and its health.
Body – Device focus; find Gateways, the Nodes attached to those Gateways, the SDI-12 devices attached to the Nodes, and the readings for the devices.
Note: When accounts collapse, they will stack vertically. You can quickly see the status of each account by looking at the symbol to the right of the account name.
Acclima Data Portal IV
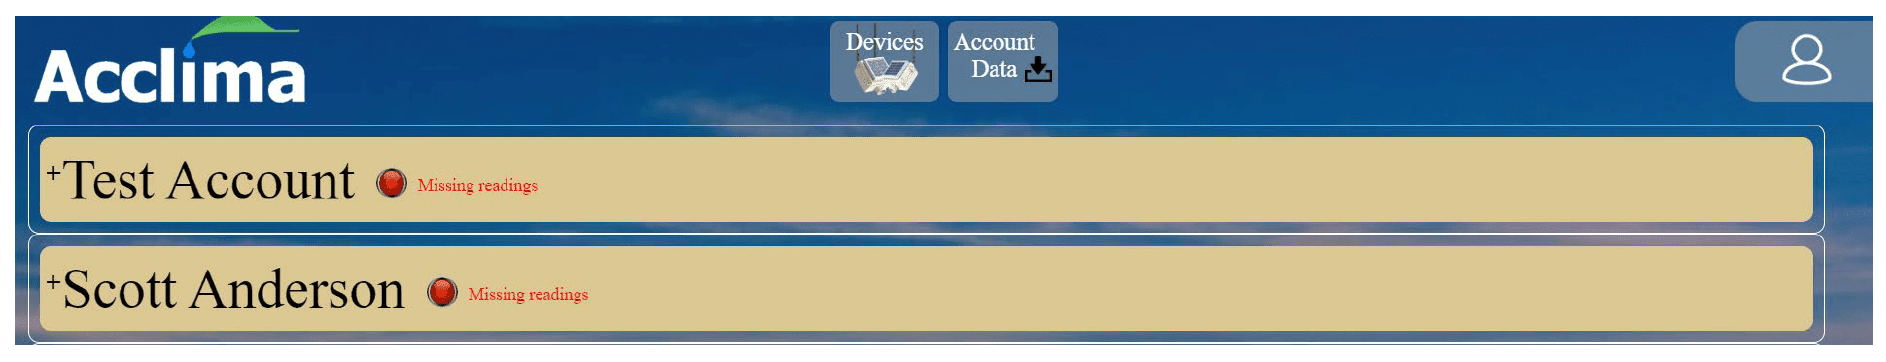
Using the Data Portal
From the home page you can view your account and
the devices attached to it. Quickly identify important
status updates about the account/devices by viewing
the status symbol color.
![]()
![]() Red = Requires Attention
Red = Requires Attention![]() Yellow = Intermittent issues
Yellow = Intermittent issues![]() Green = System is good
Green = System is good![]() Gray = Awaiting update
Gray = Awaiting update
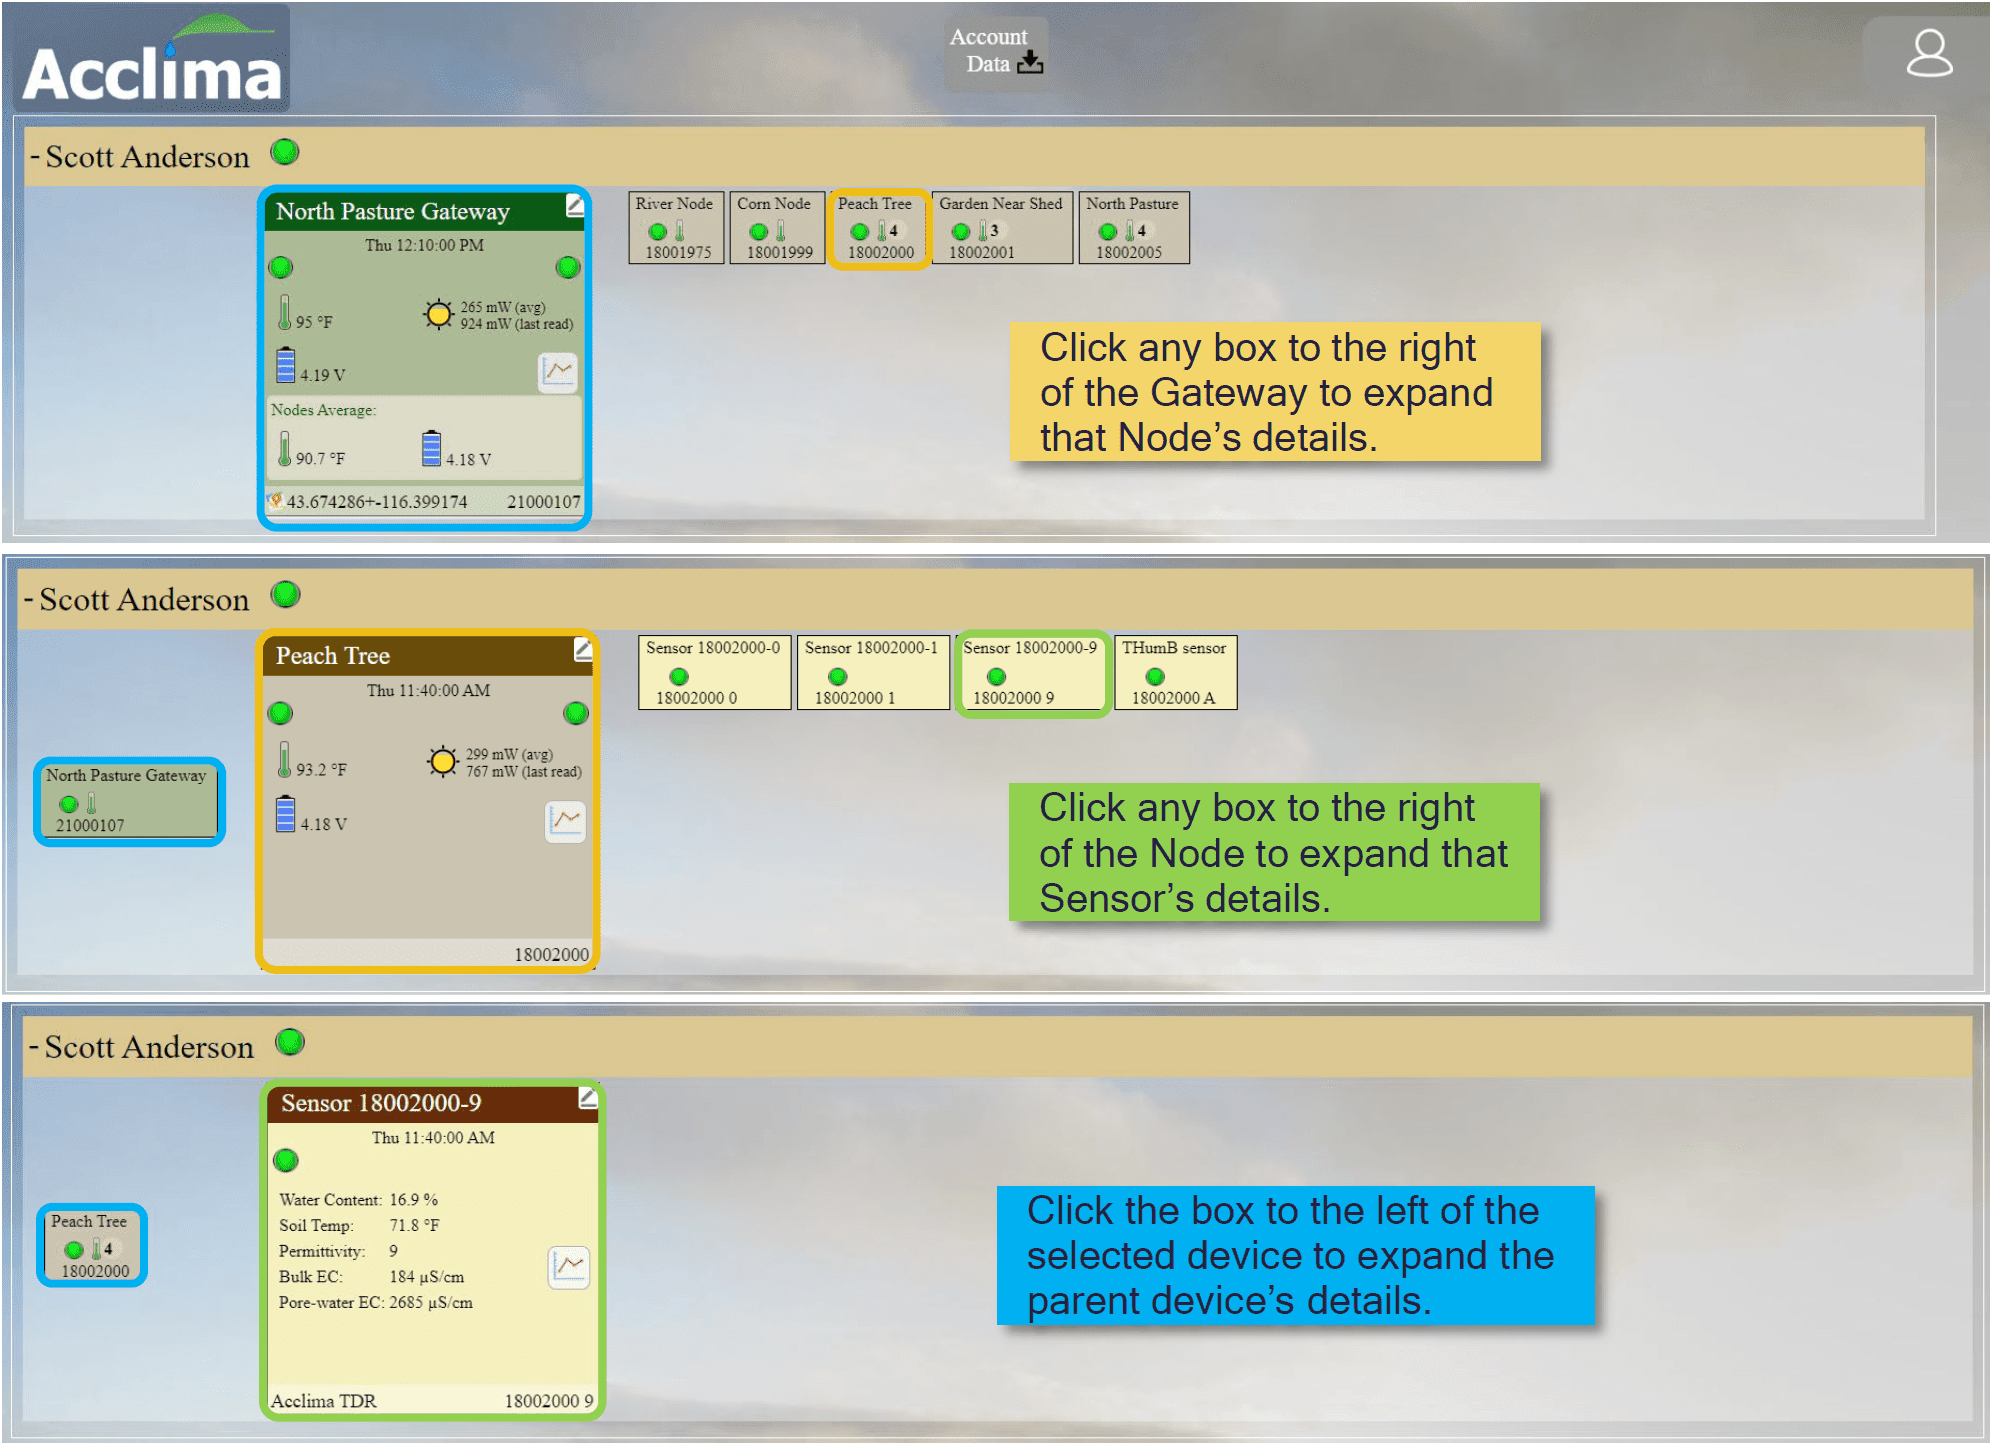
Device Focusing
Clicking an account expands it to show the connected Gateways and attached Nodes. The expanded device is the selected device. Selecting a device to the left or right expands that newly selected device displaying the device health and most recent data readings. Selecting a new device, collapses the previous device and moves it to the left or right depending on whether you are selecting a Gateway, Node or SDI-12 device.
Acclima Data Portal V
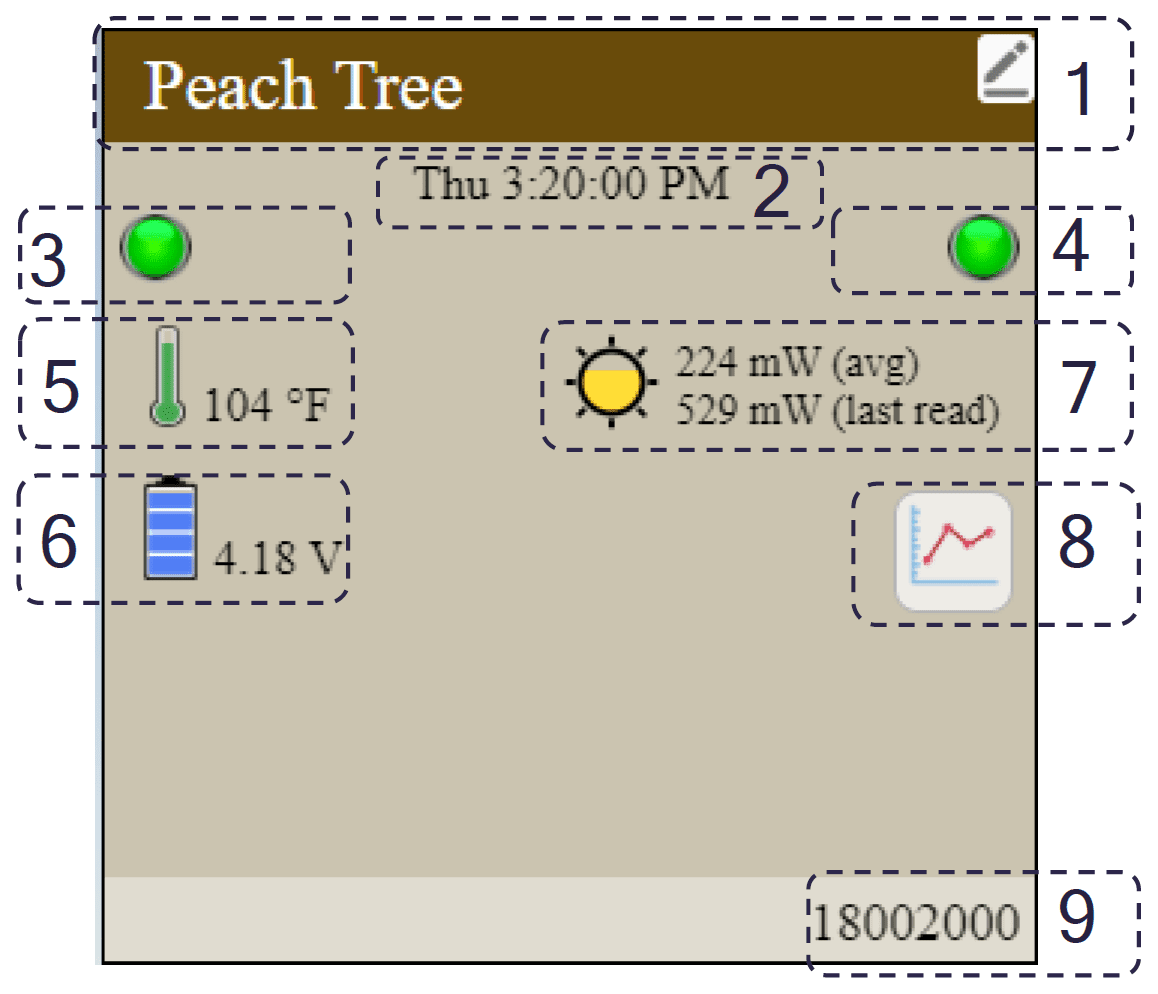
Device Focus – Gateway
When a Gateway is in focus you will find important information about its status.
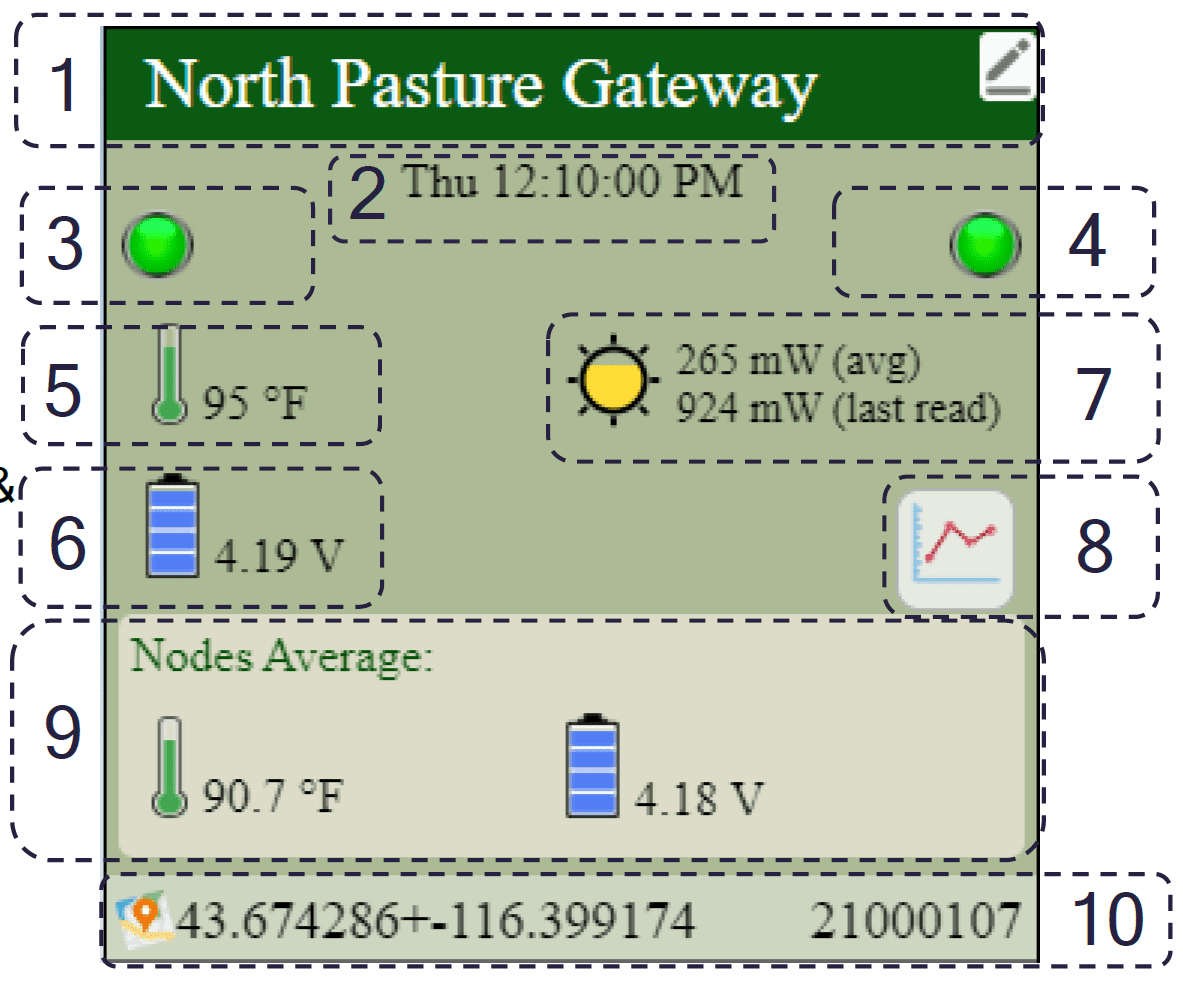
- Gateway (Device name Editor)
- Date and Time of last reading
- Detected Cellular Connection Status
- Detected LoRAa/Node Connections
- Gateway Enclosure Temperature
- Gateway Battery Voltage
- Gateway Solar Current (mW)
- Growing Degree Days
- Node Average Enclosure Temperatures & Node Average Battery Voltage
- GPS and Maps/ Gateway Serial Number
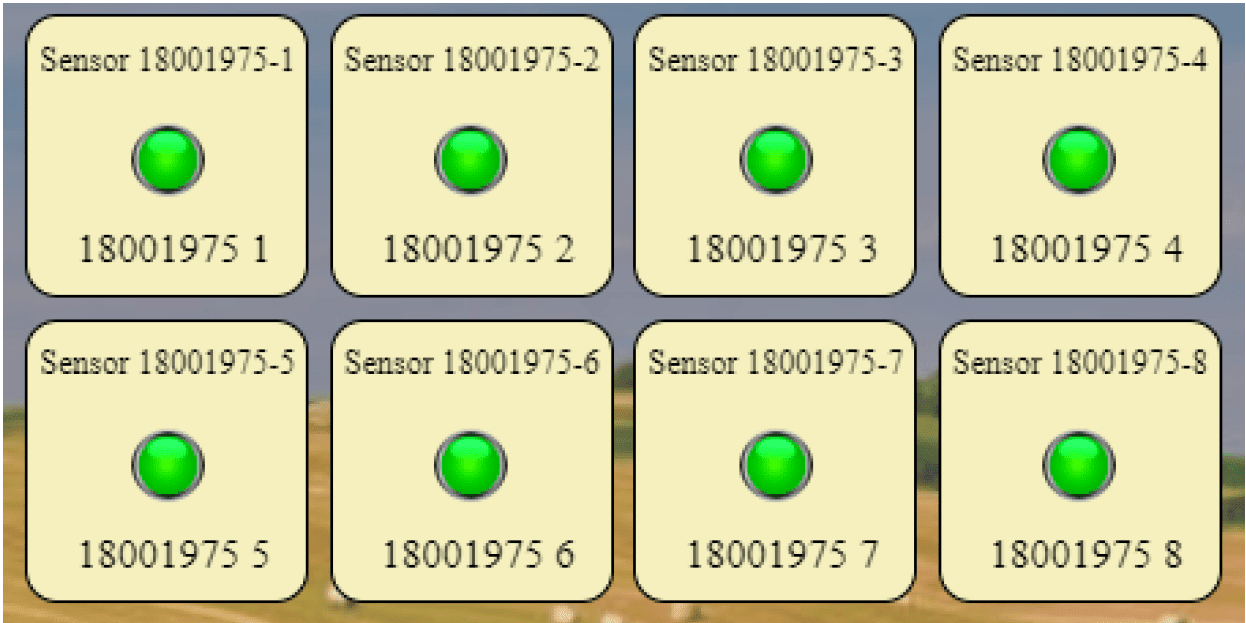
To the right of the Gateway in focus you will find all Nodes attached to that Gateway. Only 10 Nodes can be active at once. Click on an attached Node to see the details of that Node and its internal sensors.
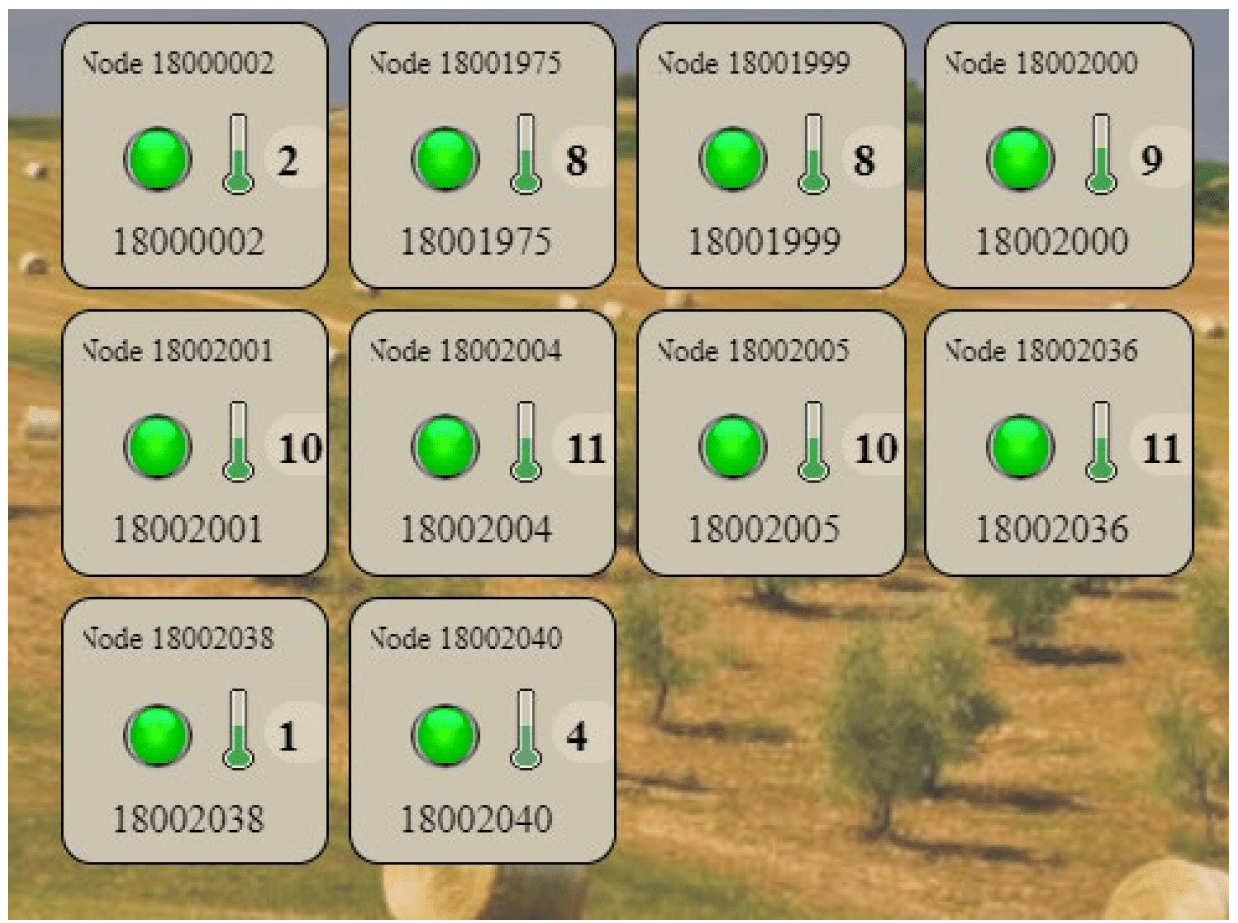
Note: If more than 10 Nodes are displayed at any time, it is because the data portal has historical data from a Node not currently in the network. Once a device has stopped reporting for longer than 2 weeks, the device will no longer be displayed on the portal.
Acclima Data Portal VI
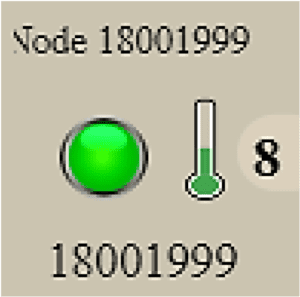
Device Focus – Node
When a Node is in focus you can see important information about its status.
- Node name (Nickname editor)
- Date and Time (Last Interval)
- Detected connection with Gateway.
- Detected connections with SDI-12 Devices.
- Node Enclosure temperature
- Node Battery Voltage
- Solar Current (mW)
- Graph Tool
- Node Serial Number
Right Stage
To the right of the Node in focus you will find all the SDI-12 devices attached to the Node.
Click on an SDI-12 device to see the details of that device.
Note: If more than 10 sensors are displayed at any time, it is because the data portal has historical data from a sensor not currently in the network. Once a device has stopped reporting for longer than 2 weeks, the device will no longer be displayed on the portal.
Acclima Data Portal VII
Device Focus – SDI-12 Device
When an SDI-12 device is in focus. You can see all readings gathered from the most recent sync interval.
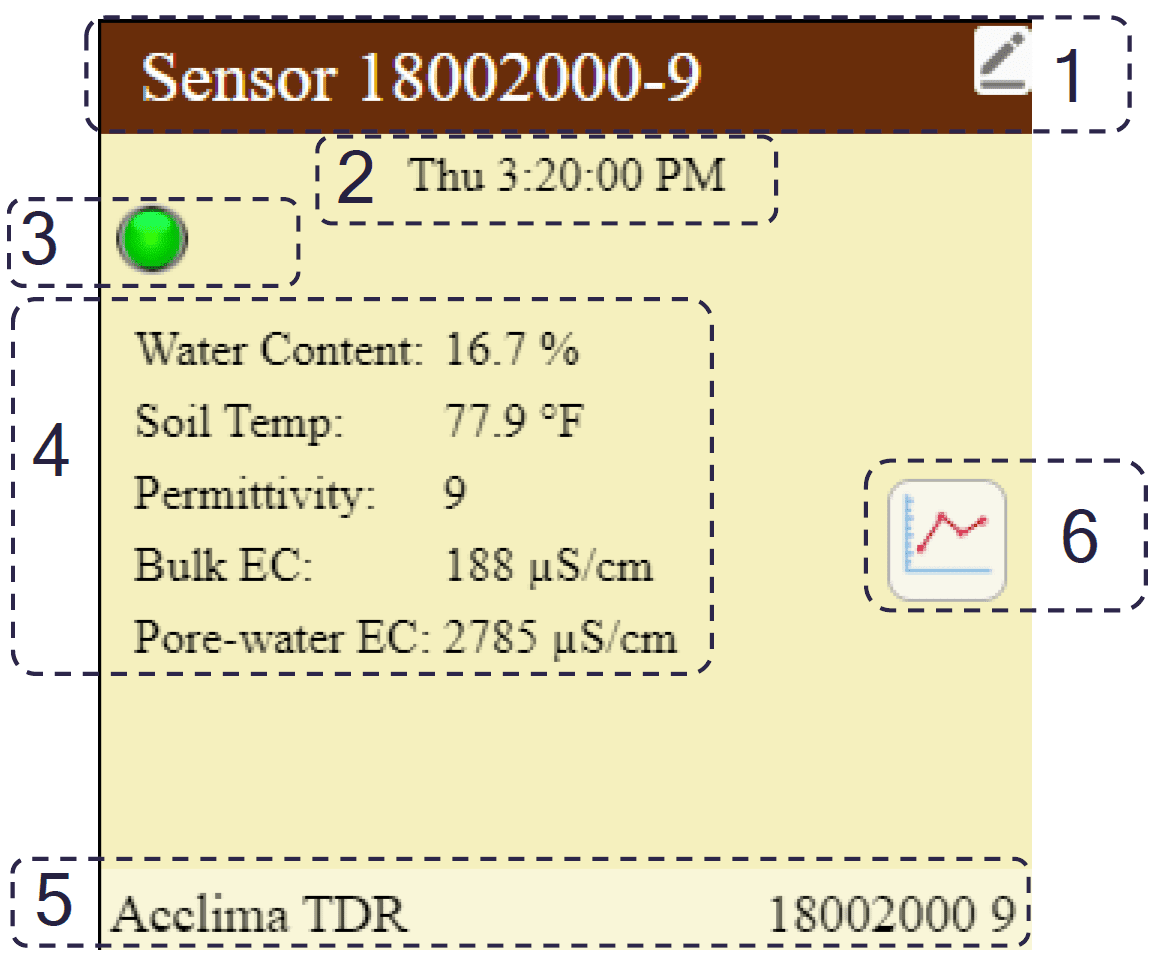
- Name Device Address (Name editor)
- Date and time (Last Interval)
- Detected connection with Node.
- (M!) Measurement command replies per last reading interval.
- SDI-12 device serial number
- Graph tool
Left Stage
Note: To the Left of the device in focus, you will find its parent device.
Click on the parent device in the left stage to be brought back to the previous device status.
Note: The size of the device box while collapsed is related to the length of characters used to name the device.
Graphing Popup Window
When a Sensor, Node, or Gateway is in focus in the dashboard, a graph window can be brought up after clicking the graph icon on the selected device.
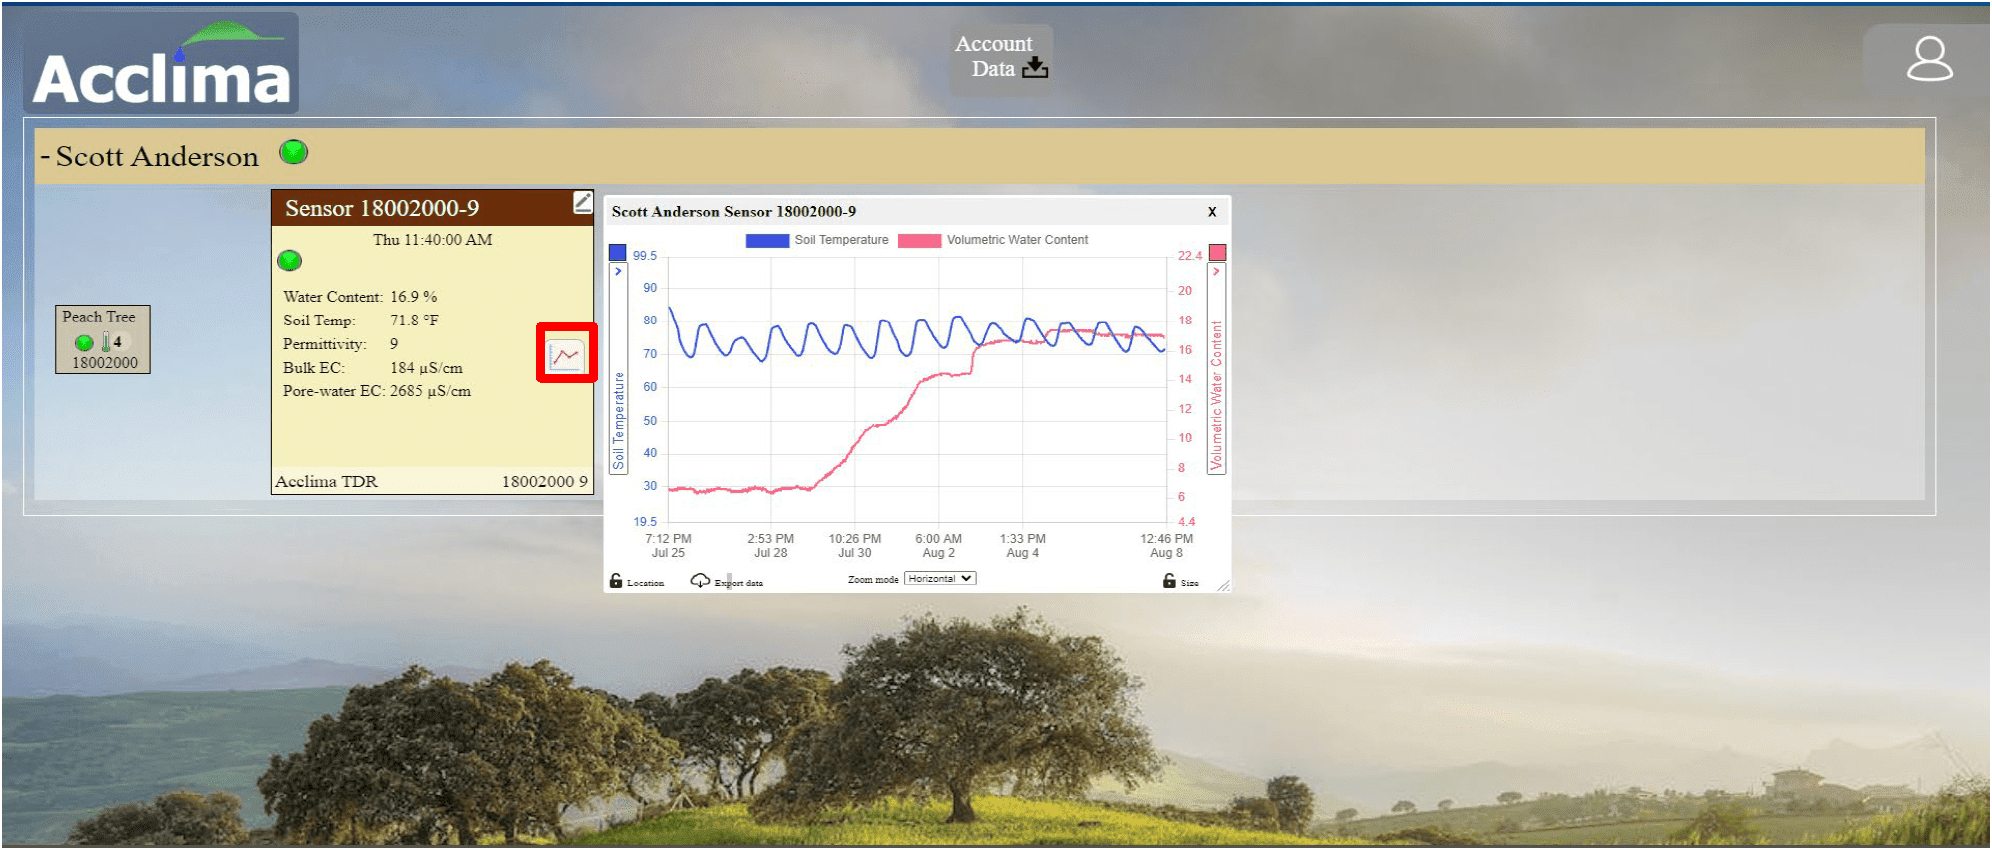
Graph Overview
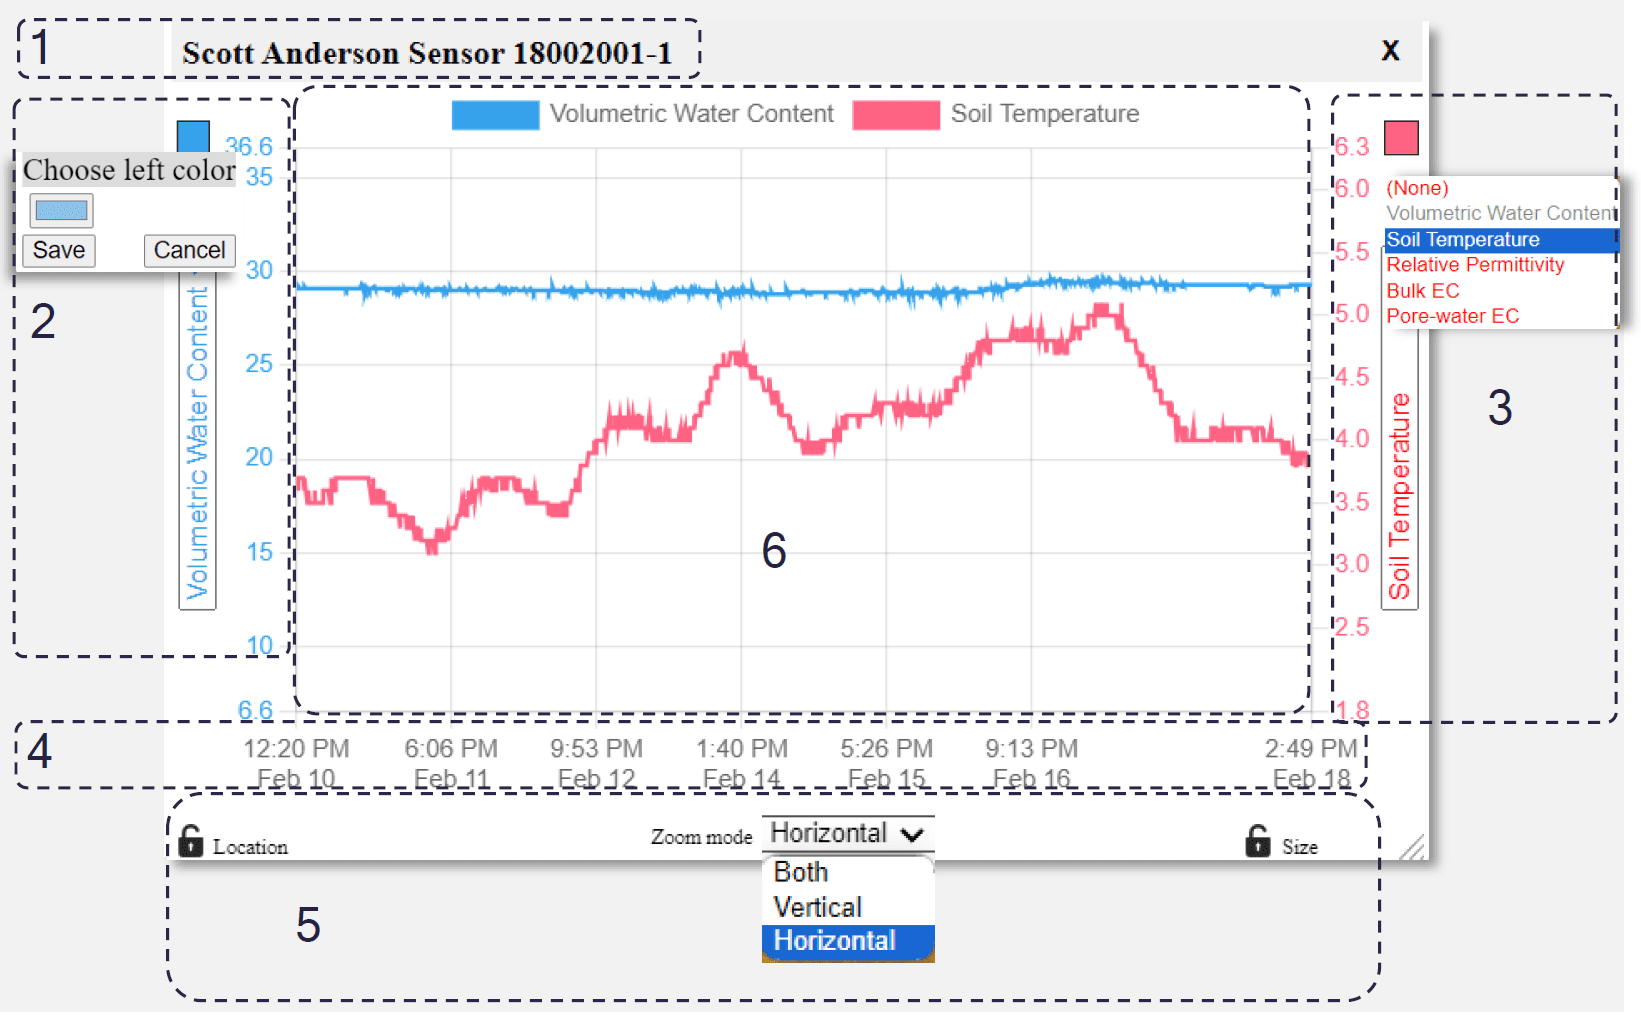
- Header Label
- Account Name
- Device Type
- Device Serial
- Sensor Address
- Left Axis
- Reading Selector
- Reading Color Picker
- Right Axis
- Reading Selector
- Reading Color Picker
- Date Range
- Window Settings
- Window Location Lock
- Scroll Wheel Zoom Mode lock selector
- Window Size Lock
- Window re-size grabber (lower right)
- Graph Body
- Mouse clicks and drags control the x and y-axis movement.
- Use the scroll wheel to zoom in and out.
Note: Two or more graphs can be launched at any given time. However, a graph cannot be opened twice.
Acclima Data Portal VIII
Downloading Data
To view the raw data table. You can export the data into a .csv file so that it can be visualized in an Excel spreadsheet or similar third-party application.
- Click the “Account Data” shortcut.

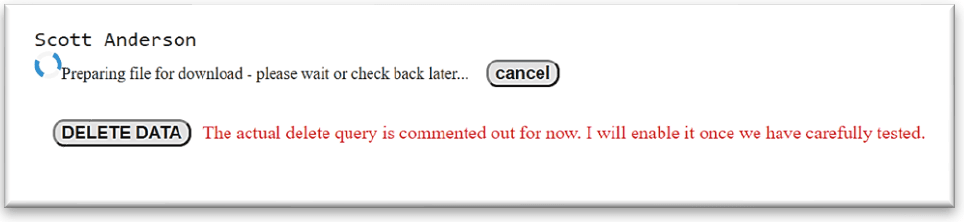
- Click “Download Data.” Note: The Cloud server will process a file conversion that exports all data, or data from individual devices currently stored on the Acclima Cloud Data Portal. This process may take several minutes.
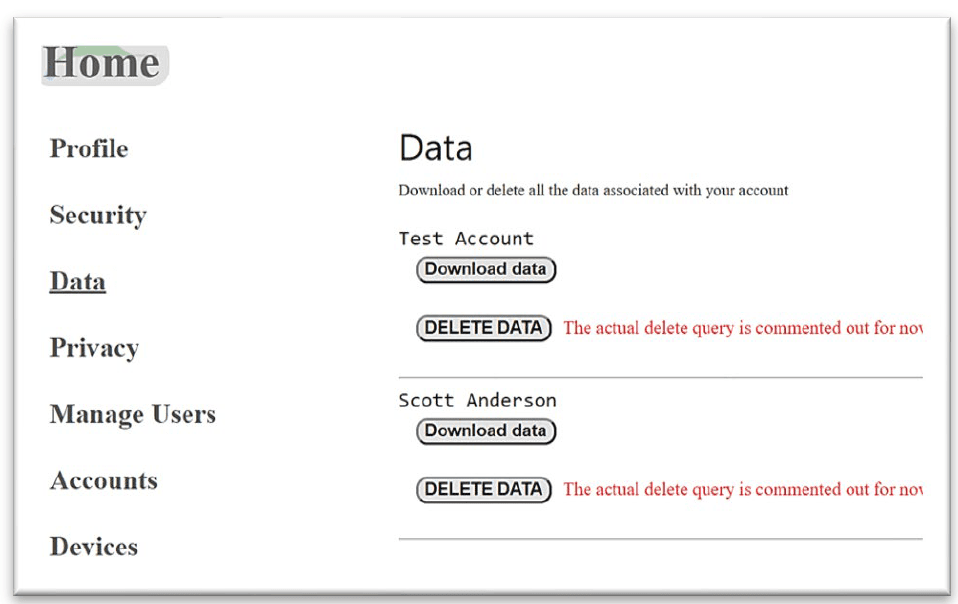
- Once the file has been created. Click “Download File” to save the file into your downloads folder, depending on your browser settings.
- You can now open the file with compatible software that supports .csv file types.
 Note: We recommend Microsoft Excel or Google Sheets
to open the .csv files.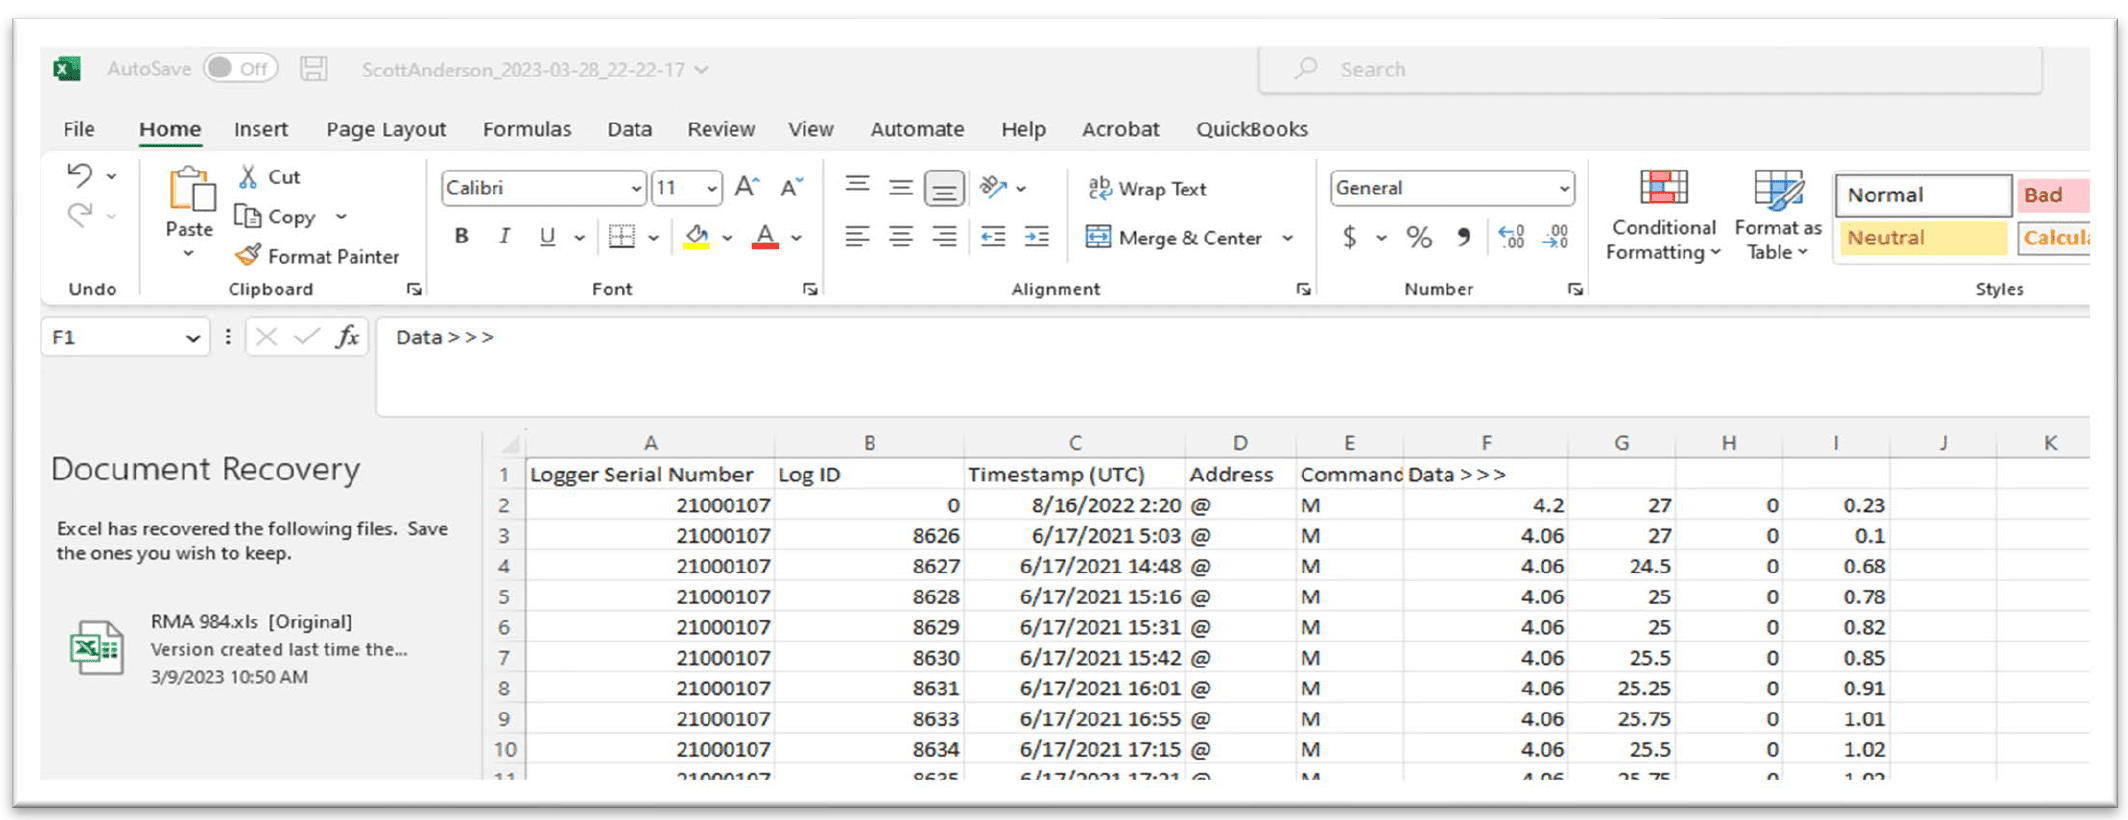
Viewing Downloaded Data in Microsoft Excel
After clicking Account Data, all the accounts that your user has access to will be listed; click the Download Data button just underneath the account you would like to access and specify the devices and time span you are interested in. Note that if you select a Gateway, all Nodes that belong to that Gateway’s network will also be included. Click Start File Prep and wait for the file to be generated. Finally click the Download File button just to the left of the file that was generated, saving the file to a location where you can find it again later (depending on your browser this may default to your Downloads folder).
Deciphering the Logs
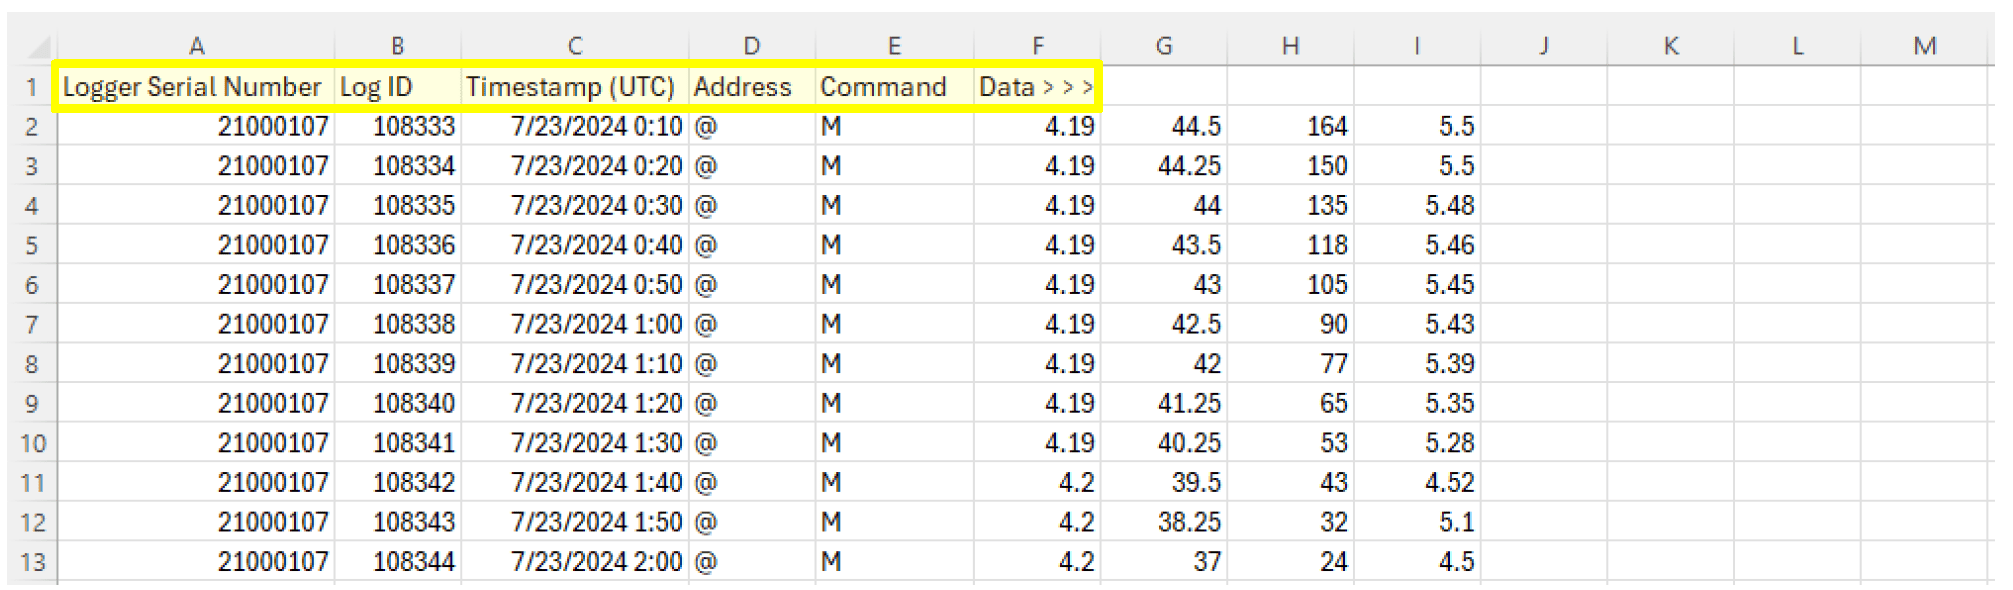
Browse to the log file (.CSV or Comma Separated Values file extension is required) and open it. If you have Microsoft Excel or another spreadsheet software installed, it will usually automatically open CSV files. If it is opened by a different program or has no default application association, you can open it manually from your spreadsheet software.
For this set of instructions, we will assume Excel is the spreadsheet software being used. Other spreadsheet software may have similar features.
The worksheet should open with the following column headers from left to right:
- Logger Serial Number
- Log ID
- Timestamp (UTC)
- Address
- Command
- Data > > >
That last column header, “Data > > >”, is meant to signify that this column and all subsequent columns will hold the measurement data. This design is meant to be flexible, and it will work with any SDI-12 sensor to simultaneously report the measurements from each sensor as well as the internal diagnostic measurements from the device. One downside to this approach is that the user must already know or must reference documentation for each sensor type to be able to make sense of the measurement. For example, for an Acclima TDR sensor, the numbers would correspond to the following readings, from left to right:
- Volumetric Water Content (VWC) [%]
- Soil Temperature [°C]
- Relative Permittivity [unitless]
- Bulk Electrical Conductivity (BEC) [μS/cm]
- Pore-water Electrical Conductivity (PWEC) [μS/cm]
Continuing the example using an Acclima TDR sensor, if all the sensors in the log file were the same, you could replace the “Data > > >” column with “VWC” and the next unlabeled column could be “Soil Temperature”, then “Relative Permittivity”, etc. This does not work, however, even if you only have Acclima TDR sensors attached to your Nodes because the internal logging device readings are also listed along with the attached sensor’s measurements.
The way we can distinguish between internal logs and attached sensor logs is by examining the “Address” column. A valid SDI-12 address can be any character from 0 – 9, A – Z, and a – z, in other words, alphanumeric. The “@” symbol is not a valid SDI-12 address and is therefore what Acclima has chosen to represent internal diagnostic readings from the Node or Gateway device. Therefore, if you see an “@” symbol in the address column, you know that the measurements listed thereafter are the internal measurements for a Node or a Gateway (corresponding to the device with serial number listed in the “Logger Serial Number” column).
Those measurements are as follows:
- Battery Voltage [V]
- Box Temperature [°C]
- Solar Current (10-ohm load) [mA]
- Solar Voltage (open circuit) [V]
Using Filter Tools and Creating New Worksheets
With the facts presented above, we can separate the logs into useful groups based on the values in the columns. This can be done with the Excel filter tool.
To enable the filter tool:
- Select the entire worksheet range by clicking the upper left corner of the spreadsheet cells. (Just above Row 1 and to the left of Column A; see screenshot.)
- Select the Data section of the ribbon at the top.
- Click the “Filter” button (looks like a funnel).
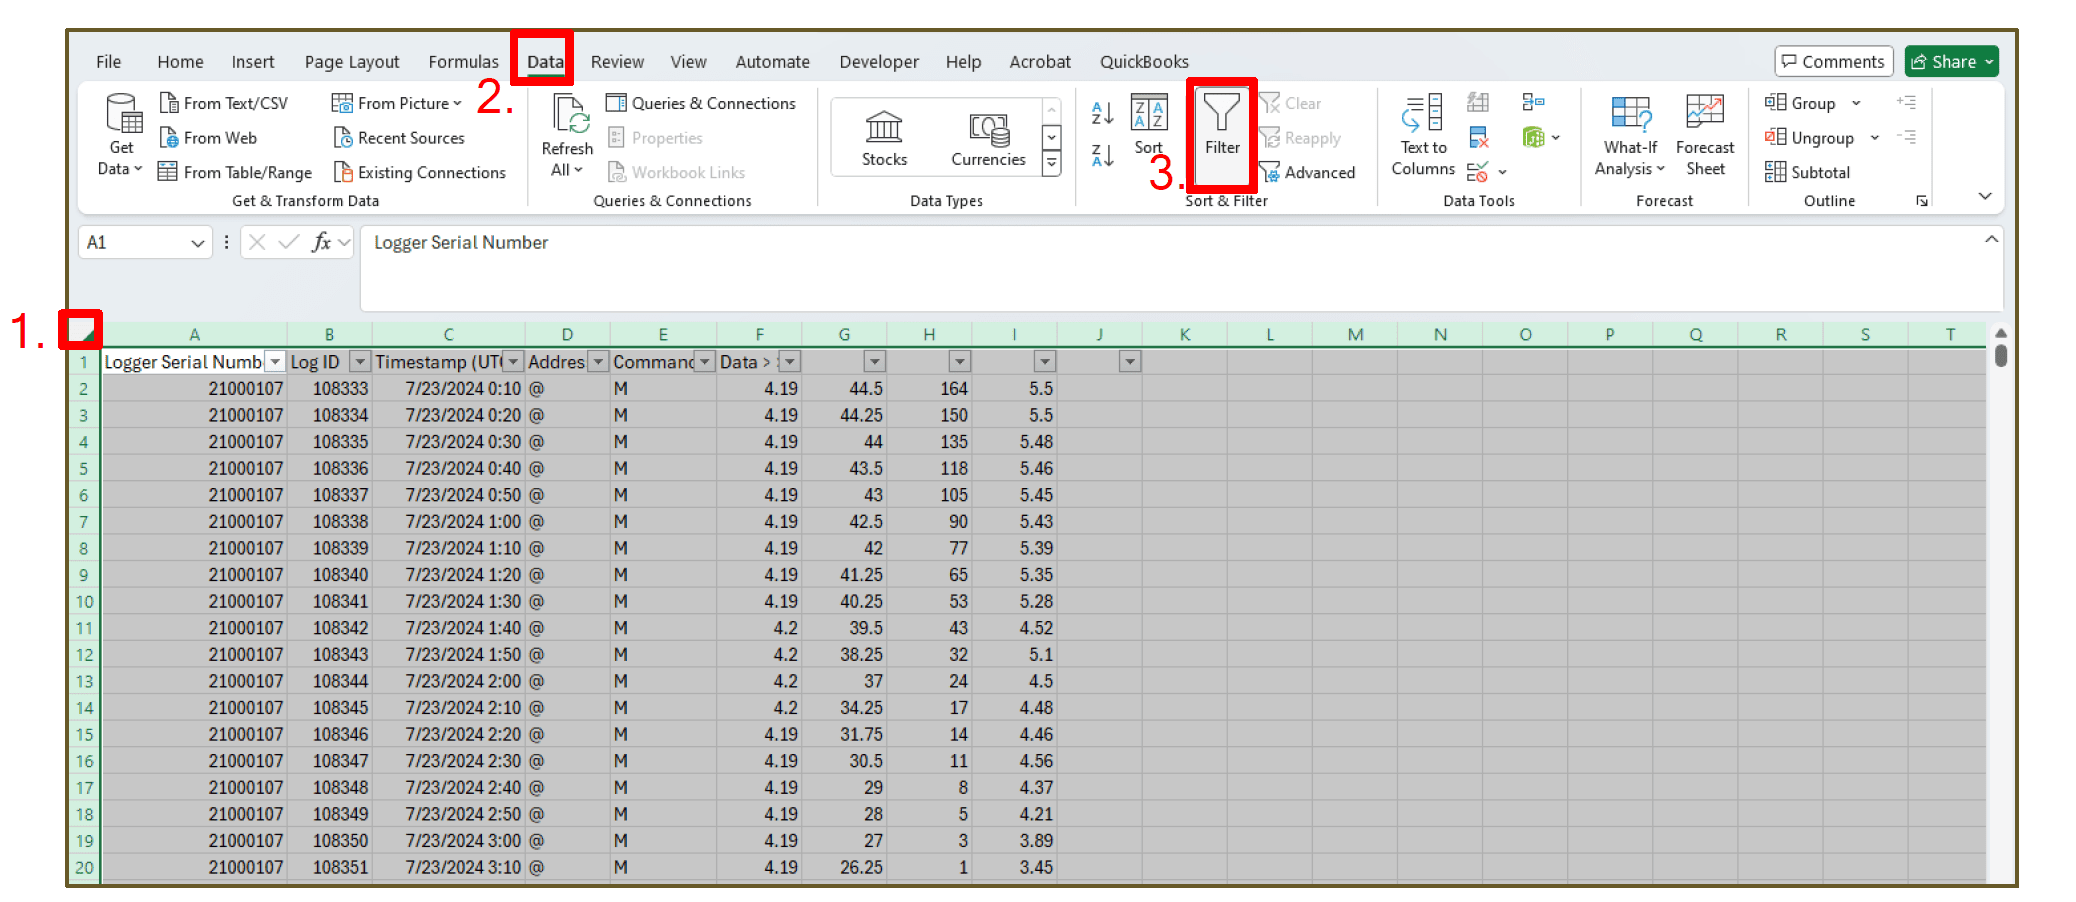
While you still have the entire range selected, if you double-click between any two column letters at the top (cursor should change to ![]() ), the column widths will auto-adjust so that contents are shown properly. This is especially helpful for the date and time that is often hidden under ####### symbols.
), the column widths will auto-adjust so that contents are shown properly. This is especially helpful for the date and time that is often hidden under ####### symbols.
With the filter tool enabled, you can now click on a column header to filter or sort. If for example you want to only view sensors that are attached to a specific Node serial number, you can click the dropdown filter button to the right of “Logger Serial Number” and make it so that only the box next to the target serial number is checked. In addition, you can further filter so that only specific sensor address is displayed by clicking the dropdown filter button to the right of “Address” and unchecking all the boxes except for the target address. Now the grid only shows readings from the target devices selected. The other readings are temporarily hidden.
You can copy the data showing in the current filter settings to a different worksheet:
- Select the entire worksheet range by clicking the upper left corner of the spreadsheet cells.
- Use keyboard copy shortcut by holding CTRL + C or by right clicking anywhere within the selection and pressing the Copy option.
- Add a new worksheet by clicking the plus in the lower section to the right of the worksheet title tab.
- Select the new worksheet and select cell A1 (to specify where to paste).
- Use the keyboard paste shortcut by holding CTRL + V.
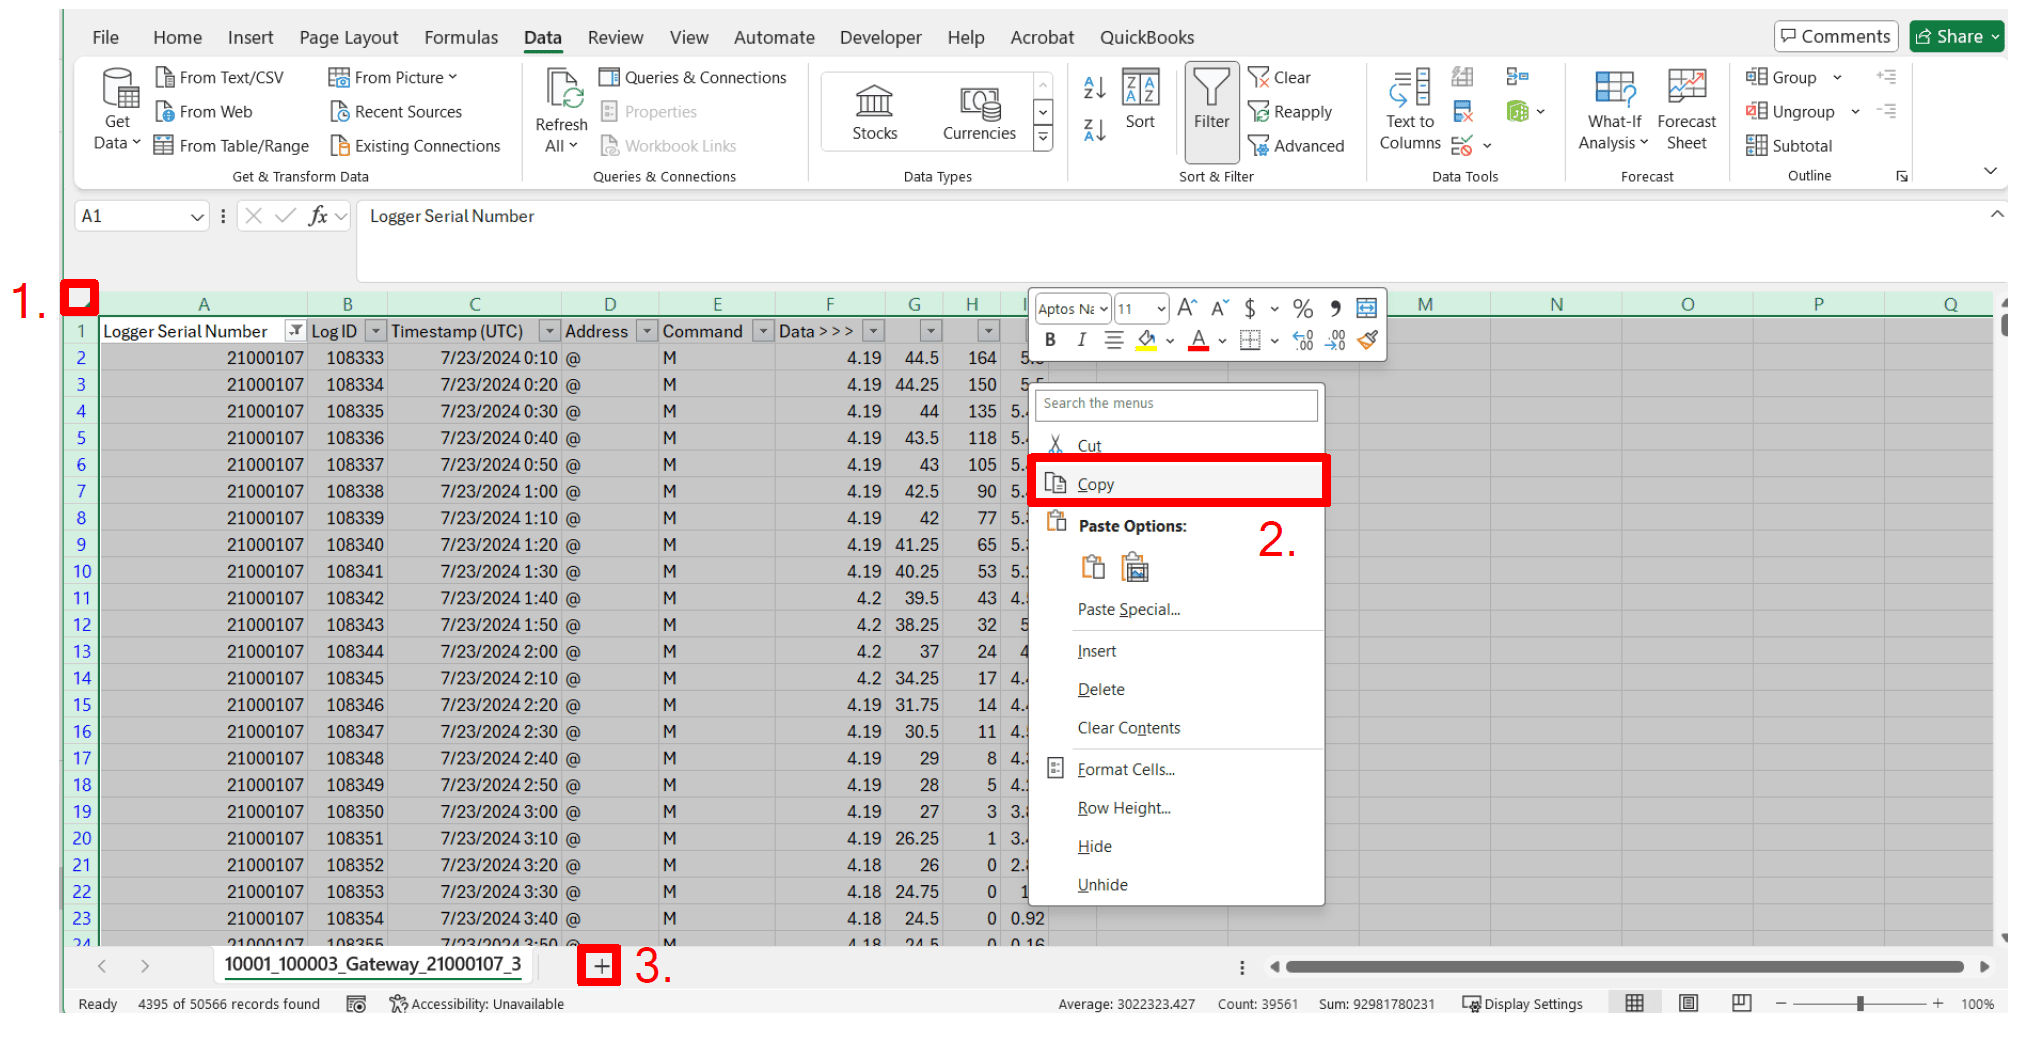
You may also change the worksheet name by double-clicking in the worksheet title tab (bottom of page where it says “Sheet1” or similar) and typing in the new worksheet name.
At this point, if desired, you could add column headers for the measurement data on this new worksheet because the data points should all be the same type. (Actually, in some cases you may also need to filter based on the “Command” column to be certain that all the data is uniform.)
Graphing Log Data
Even though you can make a dynamic graph that changes according to the filter settings, it is more straightforward to copy logs from a single sensor into its own worksheet before graphing.
Graphs are inserted into an Excel worksheet and data is specified using the following steps:
- Choose a blank cell in the space to the right of the data.
- Select the Insert section from the ribbon at the top.
- Find the Charts subsection in the ribbon.
- Click the Insert Scatter (X,Y) Chart and choose your desired style (I usually choose “Straight Lines and Markers”).
i. This will insert a blank chart (white rectangle) over the cell that was selected when you clicked insert. - Right-click the blank chart and click Select Data in the menu that pops up.
- Under the section that is labeled “Legend Entries (Series)” click Add.
- Click the cursor inside the box labeled “Series X values.”
- Click the first entry under the “Timestamp” column.
- Hold down CTRL and SHIFT keys then press the down arrow.
i. It should select all values in that column. - Use the scrollbar on the right side to scroll all the way back to the top.
- Click the cursor inside the box labeled “Series Y values”.
- Click the first entry under the “Data > > >” column.
i. This column corresponds with the VWC readings if the log is for an Acclima TDR sensor. - Hold down CTRL and SHIFT keys then press the down arrow.
i. It should select all values in that column. - Click OK to close the Edit Series window and apply the data to the graph.
The Edit Series part of graphing can behave oddly at times. In some cases, you may need to go back and edit the range. You may also want to adjust the axes and how they are presented, their ranges, etc. This is something that you’ll probably want to customize on your own to determine the best settings for you. There are many tutorials on free sites like YouTube with videos on the subject.
Note: Once you get a graph looking the way you would like it to, you can copy and paste that graph (CTRL + C, CTRL + V) into other worksheets – the data will still be associated with the original worksheet until you right click and edit the series to specify the ranges in the worksheet you copied it to.
Snapshot Data Exporting
When using the graph tool, you can export the data files the graph tool is currently displaying by clicking the Export Data button on the bottom of the Graph popup window. Doing prompts the immediate download of a .csv file of every data point displayed within the graphing tool.
Unlike the account data export method, when opening this .csv file, both reading on the right and left axis are labeled as they appear in the graphing tool. This option is available for All devices found on the dashboard.
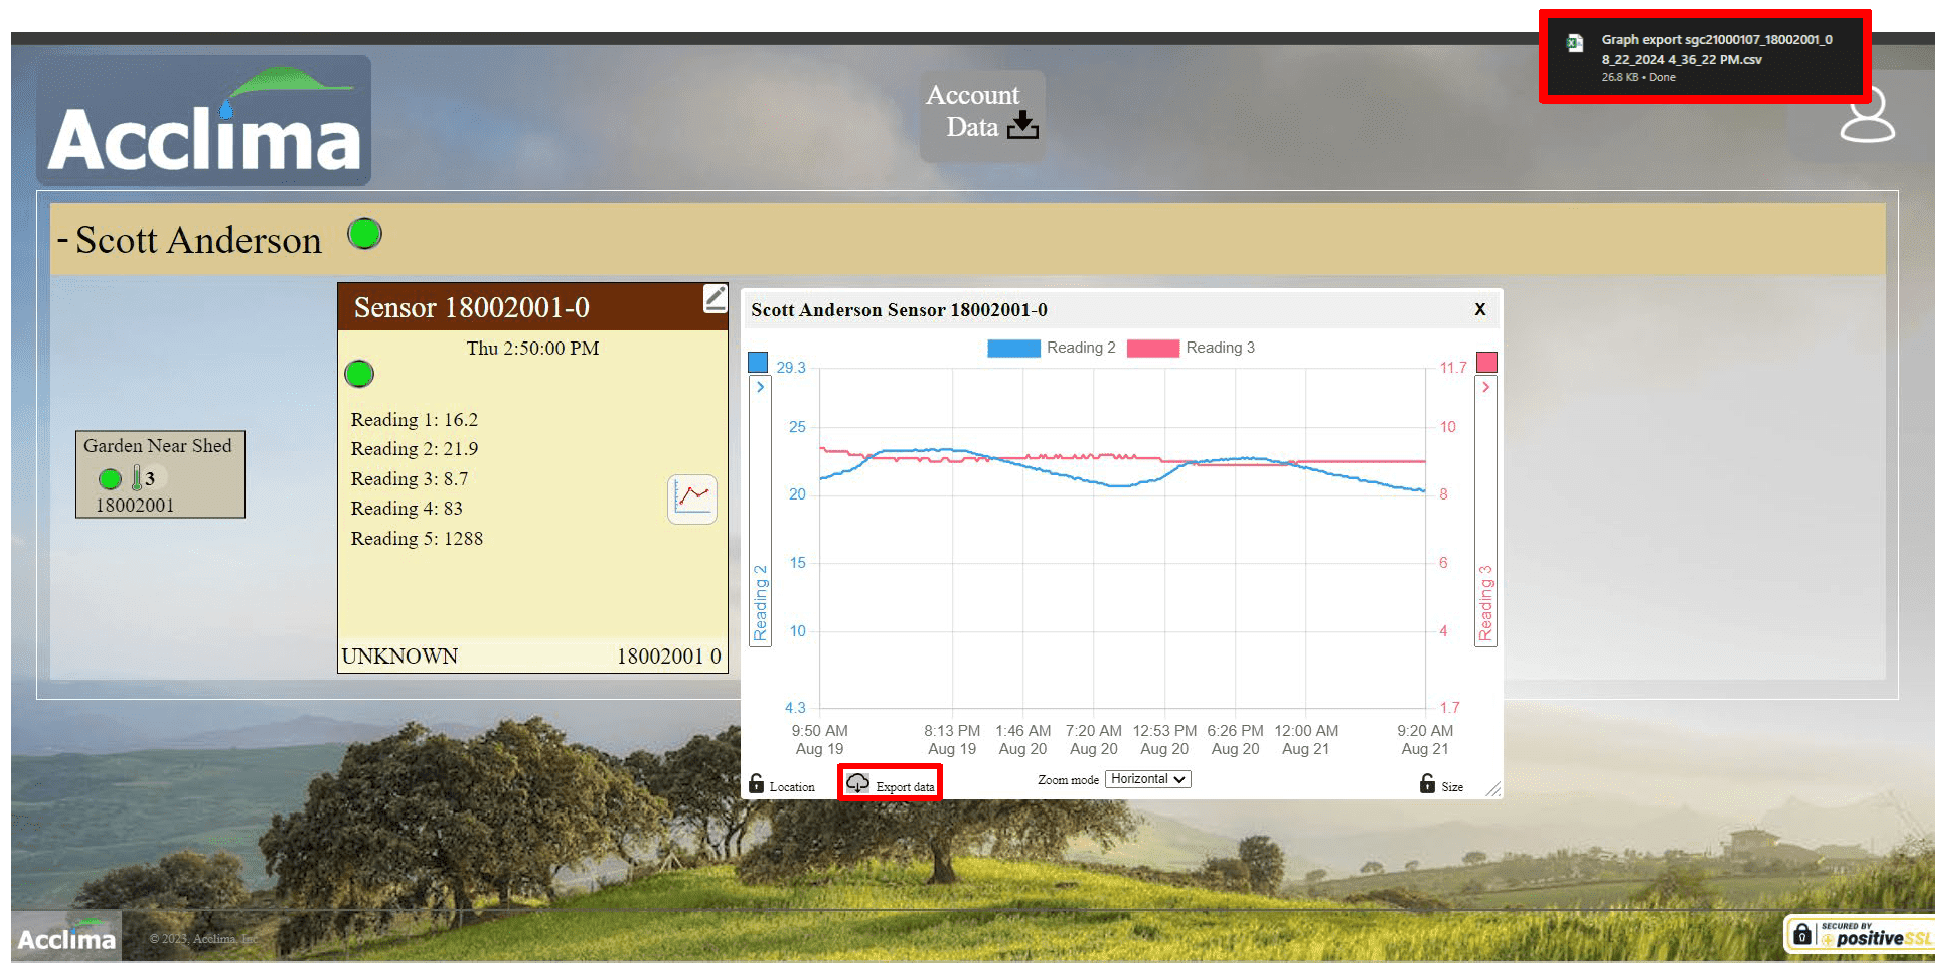
Note: If the readings are labeled generically, you may contact Acclima for further assistance.
Field Installation Guidance
Node Installation Type 1 (Subsurface cabling)
We recommend a Node be erected with a mast at a minimum of 6-8 ft above ground and it should be buried 1 ½ to 2 ft deep. Sensor cables should be routed underground, and up through the bottom of the Node mast.
Recommended Tools:
Node
- An Auger with some or all the following features:
- 1 ¾” Fluted Wood Auger
- Extension adapter approximately 18-32 inches
- Ratcheting Handle or Motorized auger/hand drill (40-70cc or 24-40v)
- Spade or Round Pointed Shovel.
Sensors (Horizontal)
- Spade or round pointed shovel (at least 36” and D handle recommended)
- Tape measure.
- Probe guide insertion tool.
Recommended Materials
- 6-10ft Schedule 40 furniture PVC pipe per Node/Gateway.
– Should allow Node/Gateway to clear crop canopy.
– Taller = Better for long range communication
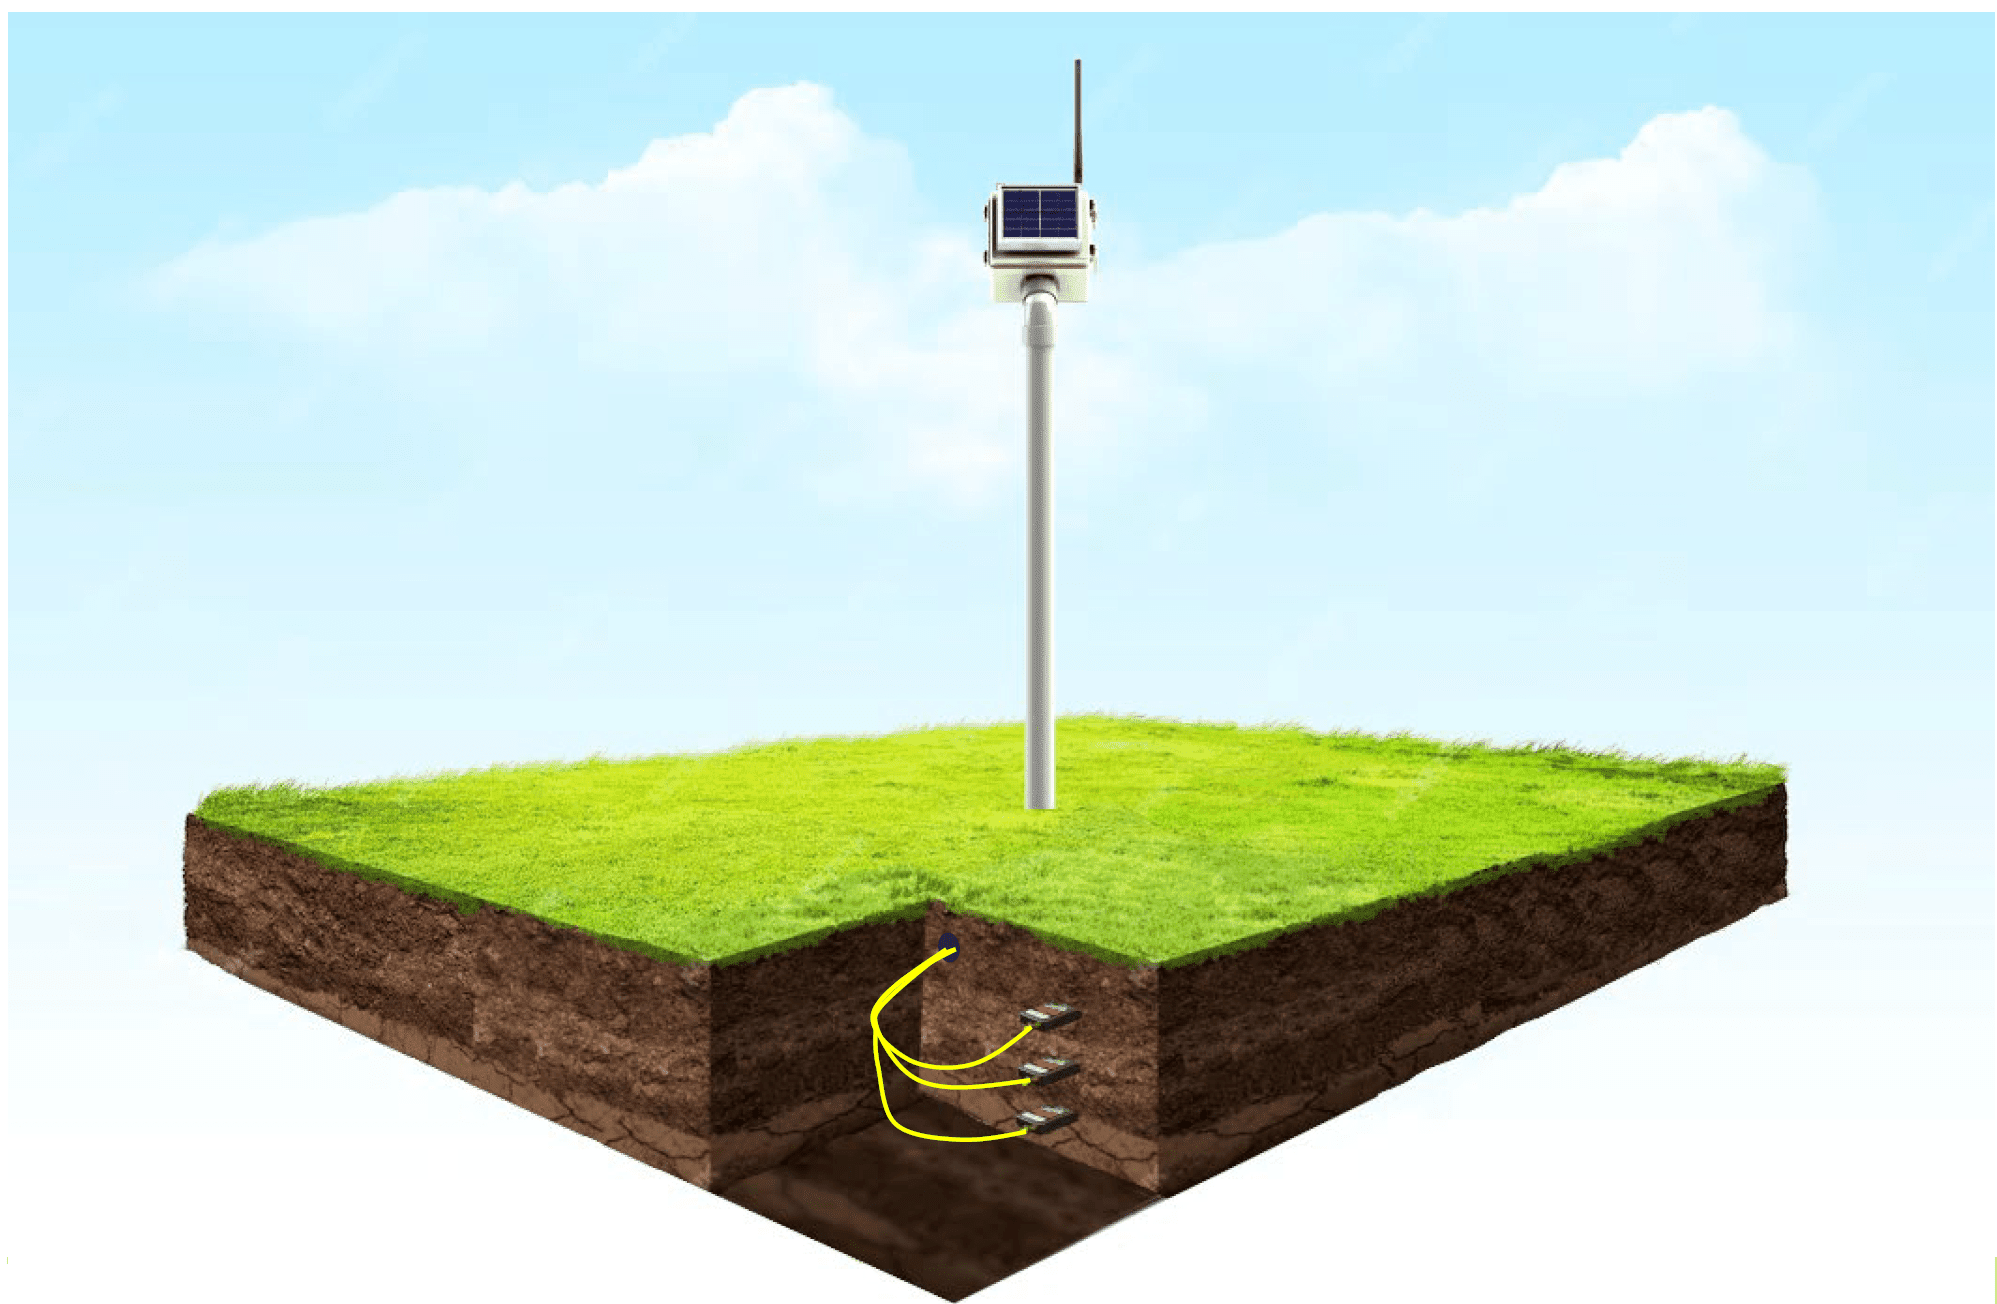
Node Installation Type 1 Instructions
Step 1: Use a shovel to excavate a cylindrical hole approximately 18”-24” inches deep. Keep the excavated soil nearby so that it can be used to fill any gaps between the mast and the soil sidewall later. Measure and mark the distance where the
sensors are to be installed. This measurement should account for mast assembly height, depth and total sensor cable length and target location.

Step 2: Carefully excavate the area in which the sensors will be monitoring. Ensure that the sidewall is flat as possible. Set the exhumed soil onto a tarp
nearby for accurate backfilling and recompacting of the soil over the sensor bodies and cables later.

Step 3: Place the probe guide insertion tool flush against the side wall of the media. Then insert the sensor rods through the open spaces of the probe
guide. This ensures that the sensor rods are not damaged while being forced into tough media. Push the rods horizontally into the sidewall until the sensor body is flush against the wall.
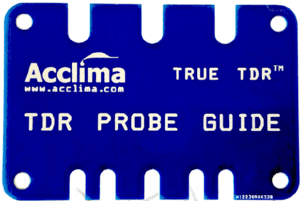
Note: Do not wiggle the rods while inserting the waveguides.
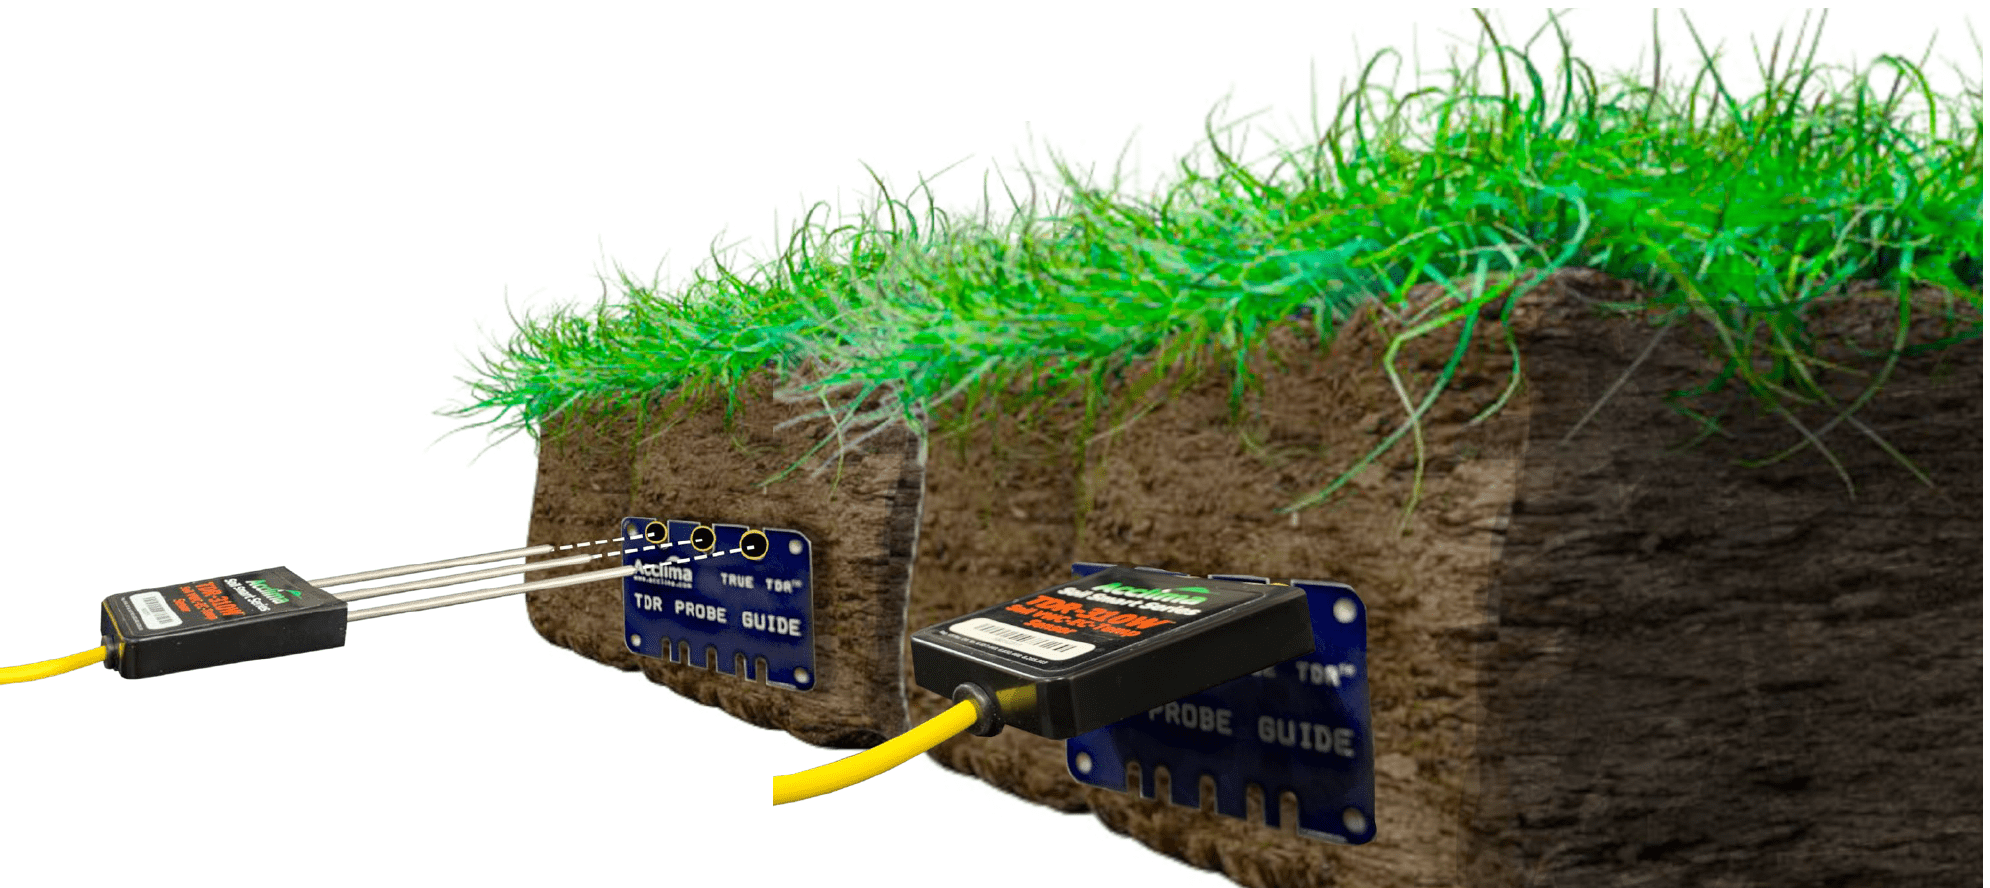
Step 4: Route the sensor cables up through the lower part of the mast out through the top of the mast. Leave at least a foot of cable protruding from the top of the mast, so that the cable can reach the Node’s terminal ports.
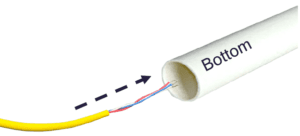
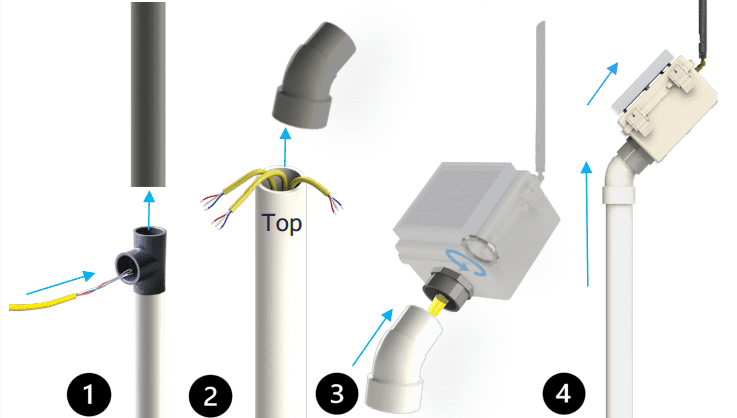
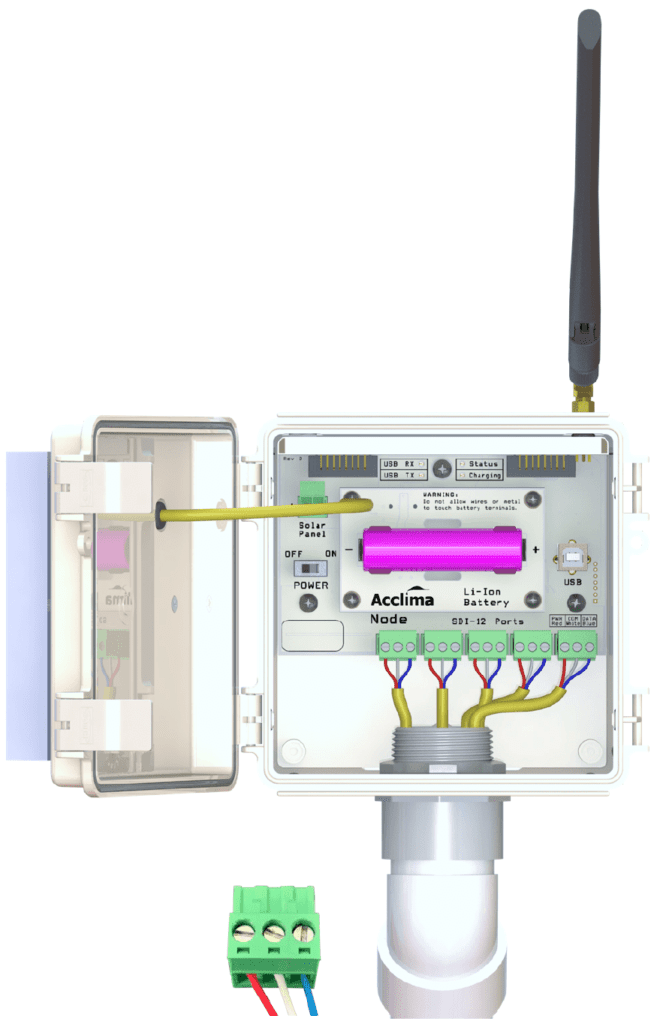
Step 4: Lower the Node and cables into the hole for the Node, and back fill the hole with the previously exhumed soil. Compact the soil around the mast to reinforce its structure while erected.
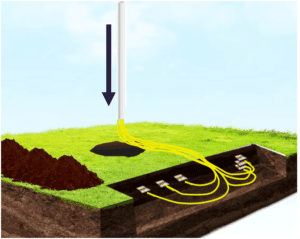
Step 5: Dig a shallow trench about 6-12 inches deep to hide the cables underground.
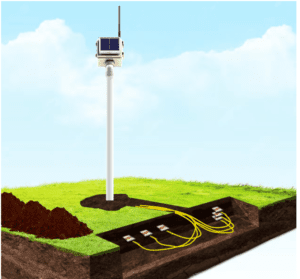
Step 6: Perform the same backfilling and compaction of the exhumed soil around the sensors until the soil has reached the same level of compaction it was prior to it being removed.
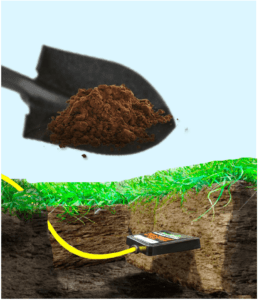
Step 7: After refilling the cavities. Use your first or boot to stamp the soil back into its original density. Try to avoid wiggling the sensor body, which can
create airgaps around the waveguides.
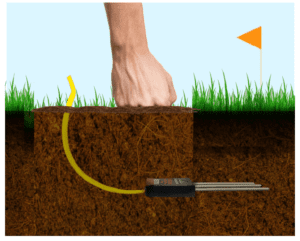
Step 8: Plug in the SDI-12 terminal blocks into the ports on the Node. Tighten the LoRa antenna and flip the power switch [On], close the lid and face the solar panels towards the southern sky.
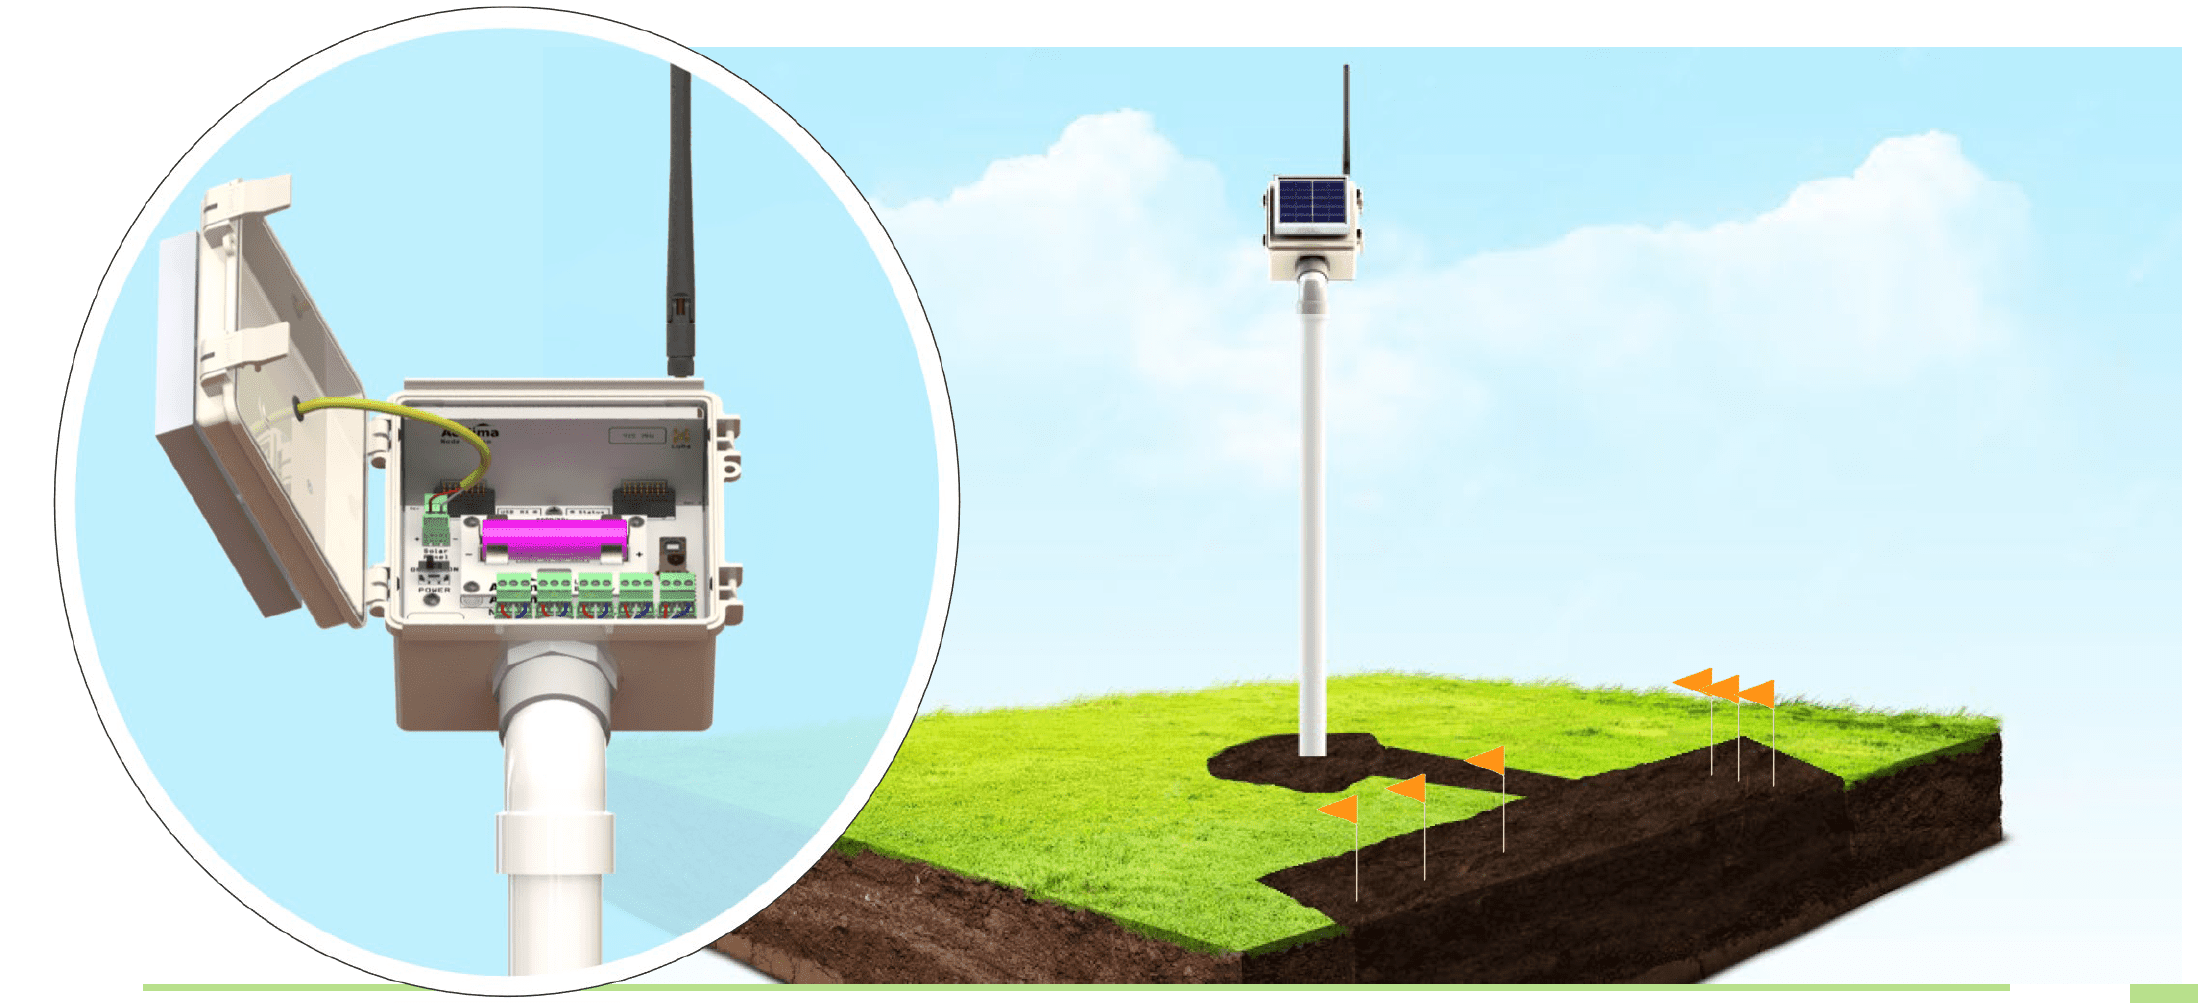
Node Installation type 2 (Above surface cabling)
In some situations, it is recommended that round body sensors be installed vertically, doing so allows for more serviceable installations and provides average moisture reading over a depth of about six inches at the target depth.
Recommended Tools
Node/Gateway (Compact soils)
- Auger with the following features:
a.) 1 ¾“ Fluted Auger or Spade Shovel
b.) Extension length 18 to 32”
Sensors:
- 1-3/8” Flat-bottomed Auger
- Waveguide Insertion Tool
Materials
- 1x 4ft 1 ¼” schedule 40 furniture PVC pipe (lower mast per Node)
- 1x 1 ¼” Schedule 40 furniture PVC coupler (per Node) (3-way, 4-way, or 6 way)
- 1x 4-6ft 1 ¼” schedule 40 furniture PVC pipe (upper mast per Node)
- 1x 10ft 1 ¼” Schedule 40 furniture PVC pipe (per Gateway)
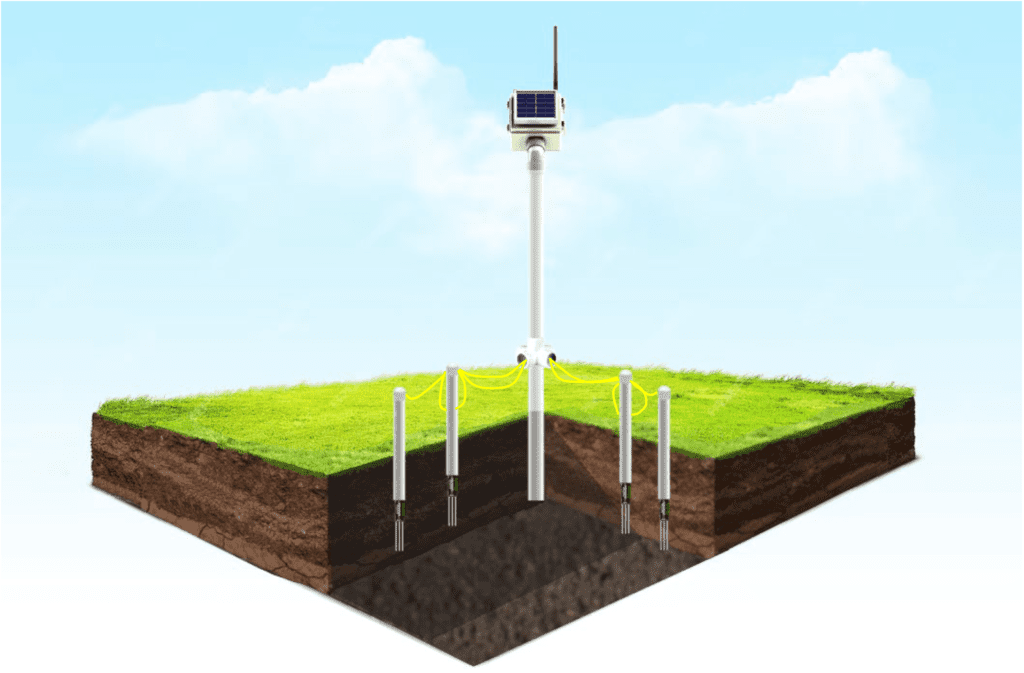
Round body Sensor and Pipe Assembly
Tools
- Power Drill at least 20v.
- Drill bit 1/4”.
Materials
310N/305N Sensors
- 1” schedule 40 Furniture PVC pipe, length (any). Note: Allow at least 1ft of PVC pipe to be raised above the surface.
- PVC glue (permanent modification) (voids warranty).
- Plumber’s putty sealant.
Assembly Instructions
Step 1: Drill a hole with 5/8” drill bit into once side of the PVC pipe.

Step 2: Feed the Yellow cable through the bottom of the pipe and out the hole.
Step 3: Use a small amount of PVC glue along the edge of the round body
sensor to adhere and seal the PVC pipe to the sensor body.
Step 4: Place PVC cap onto the end of the PVC pipe and seal any openings with plumber’s putty.
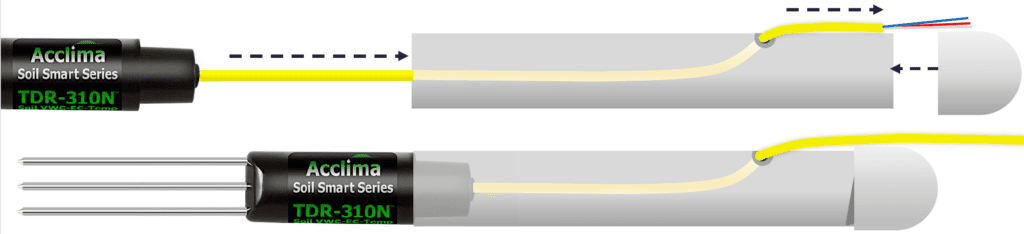
Step 1: Use an auger and extension to bore a 1-5/8” hole approximately 18 – 24 inches deep.
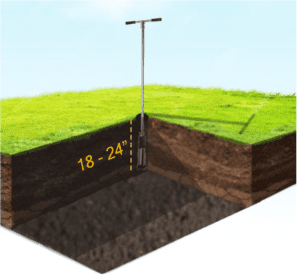
Step 2: Insert the lower 3’ – 4’ mast into the hole. Add the 3-, 4-, or 6-way tee fitting Schedule 40 coupler to the top of the lower mast. Then connect the 4’ – 7’
upper PVC pipe to the coupler and lower mast assembly. Finally, connect the 45° elbow and neck to the Node.
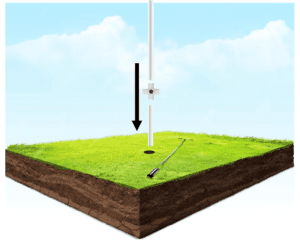
Step 3: Use a 1-3/8” auger to bore the desired number of holes for each sensor to the desired depths. Insert sensors into the holes and apply even
force on the top of the PVC pipe caps to force the sensor rods into the soil.
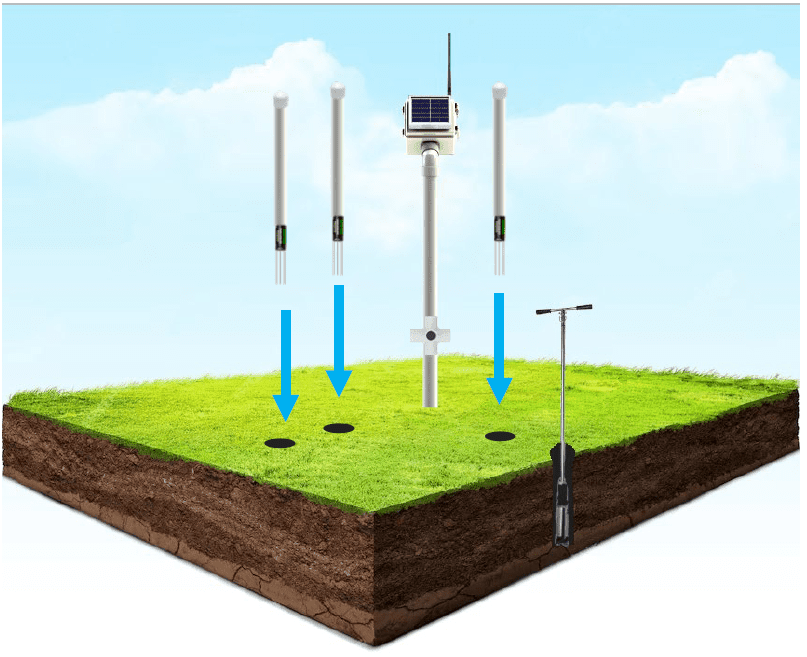
Note: The Node supports up to ten sensors, at maximum radius of 200ft away.
Step 4: Route the sensor cable from the end of the sensor into the opening of the 3, 4 or 6 PVC couplers, and up through the upper mast and into the Node. Terminate the SDI-12 pigtail wires into the green terminal blocks and plug the blocks into the green terminal ports on the Node. Power the Node [On].
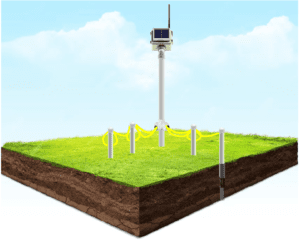
Gateway Installation
The Gateway can be installed simply by digging any size hole to 18-24 inches. Then inserting the Gateway mast into the hole and recompacting the soil around the mast.
Recommended Tools
Gateway
- Auger with the following features:
- 1 ¾” Fluted Auger
- Length (extension) = 16-32”
- Motorized auger/hand drill (40-70cc or 24-40v)
- Round pointed shovel.
Materials
- 8-10ft Schedule 40 furniture PVC pipe per Node/Gateway.
- Measuring tape.
- Waveguide insertion tool.
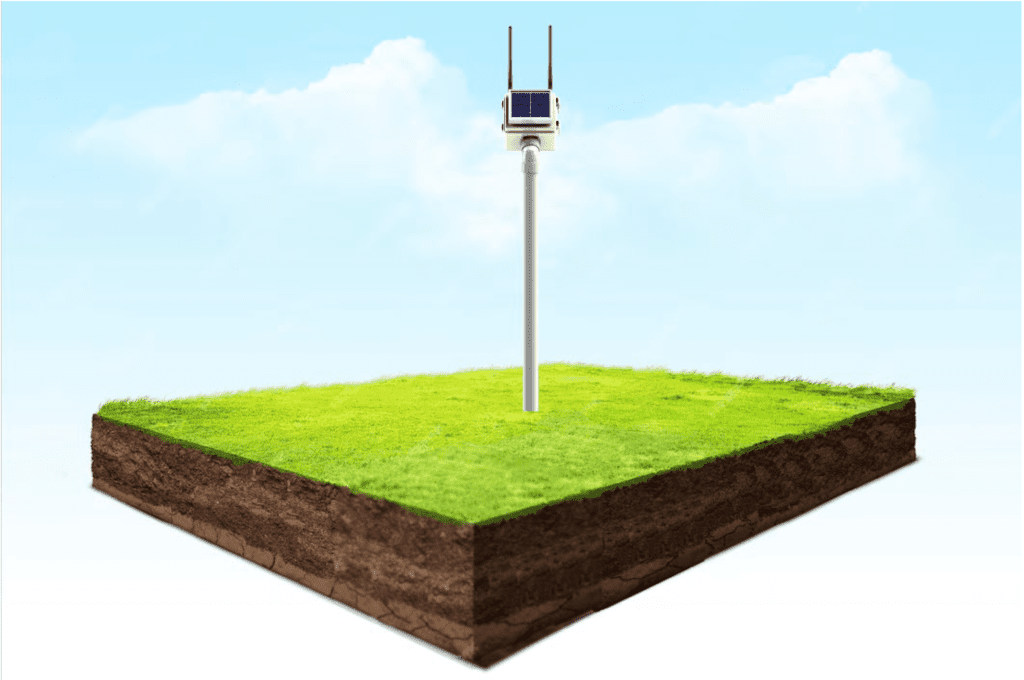
Step 1: Find a location for the Gateway that has a clear line of sight view within 5 miles of the target Node. This area should be clear of any obstructions including trees, buildings, metallic objects, and large natural structures.

Step 2: Use a 1-3/4” auger to drill a borehole for the Gateway Mast.
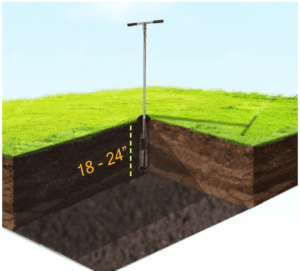
Step 3: Complete the Gateway and mast assembly.
Step 4: Insert the Gateway mast assembly into the borehole and backfill any gaps between the mast and sidewall of the bore hole. Power the Gateway [On], close the lid and face the solar panels towards the southern sky.
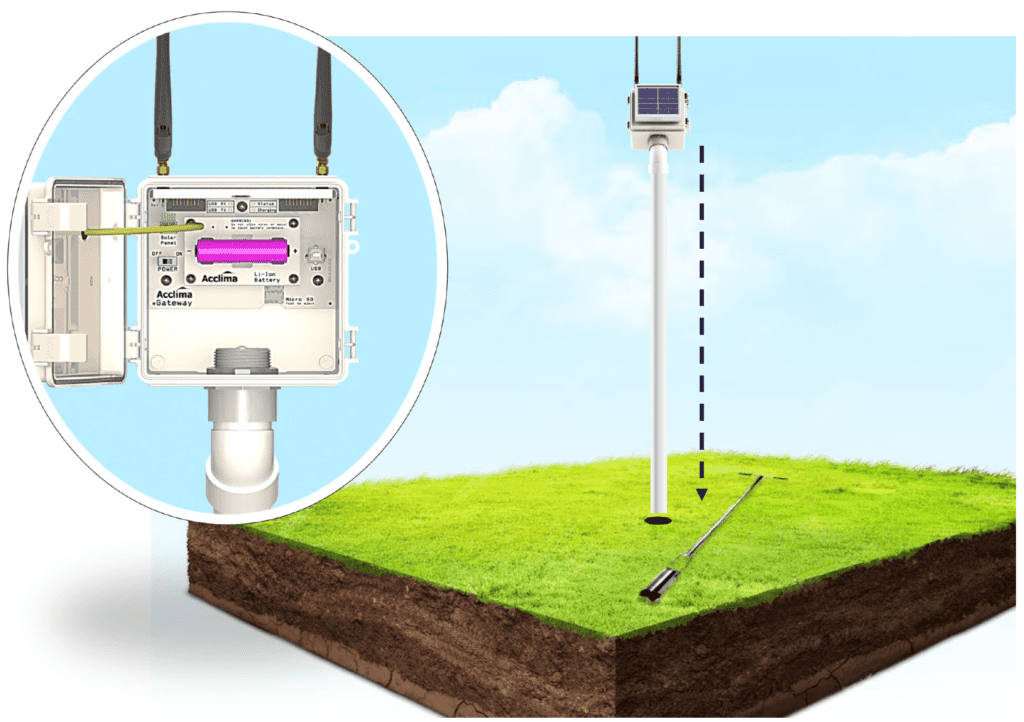
Field Assembly Complete
- Power device [On]
- Face the solar panels towards the sun.
- Securely seal the lid.
- Check the Acclima Data Portal to view sensor readings.

Post Field Installation
After a Gateway Network has been installed in the field and powered on. The Gateway will begin to reach out to nearby cellular towers on the GSM frequency bands. The configuration information should populate onto the data.acclima.com portal within 30 minutes if a strong cellular network was located. Meanwhile, the Gateways and the Nodes will attempt bidirectional communication over LoRa wireless radio. The Nodes’ configuration information, including SDI-12 devices attached, will be shared with the Gateway they are networked with. This information will be transmitted to the data portal by the Gateway typically within 1 – 2 hours. If the Gateway information does not appear in your account on the data portal within 24 hours, contact Acclima. If the Gateway does appear, but also is missing readings, please wait up to 48 hours until the configured Node’s data populates into the data portal. As long as the devices are powered on and configured, they should log data, even if they are outside the range of LoRa radio or cellular towers. If the data portal never shows a particular Node, its radio range mode may need to be adjusted.
Troubleshooting
Gateway Troubleshooting Flow Chart
Double-check the following: If a Gateway network is experiencing technical difficulties.
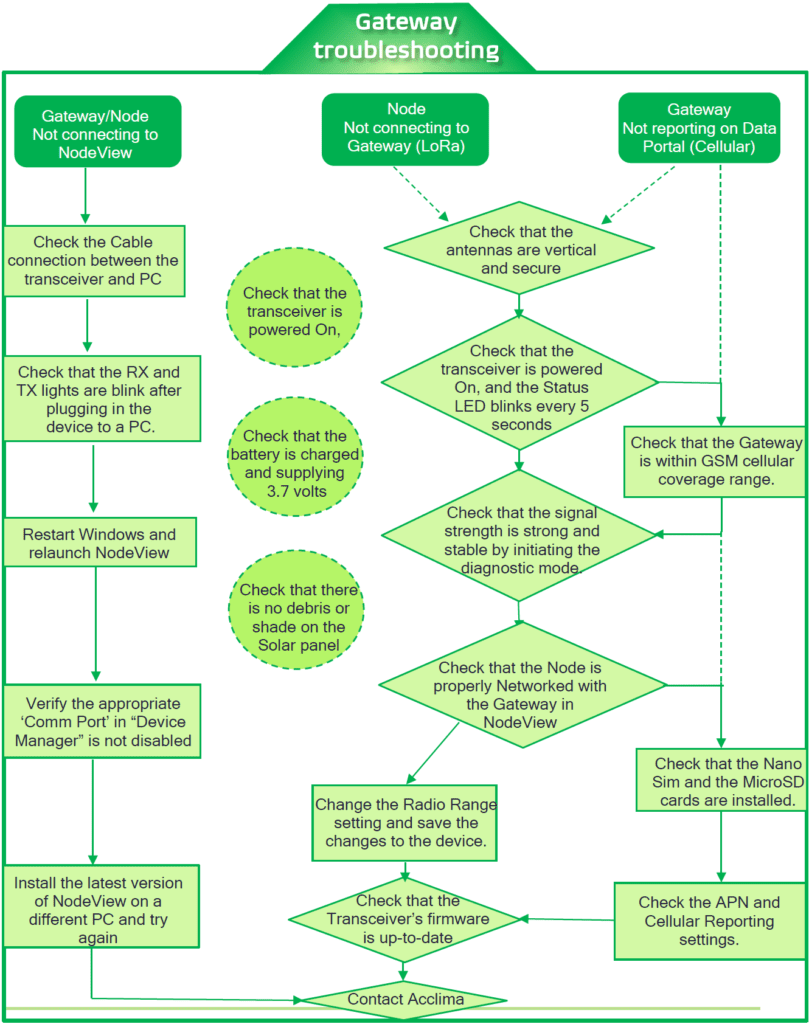
Sensor Troubleshooting Flow Chart
Double-check the following: If a sensor is experiencing technical difficulties.
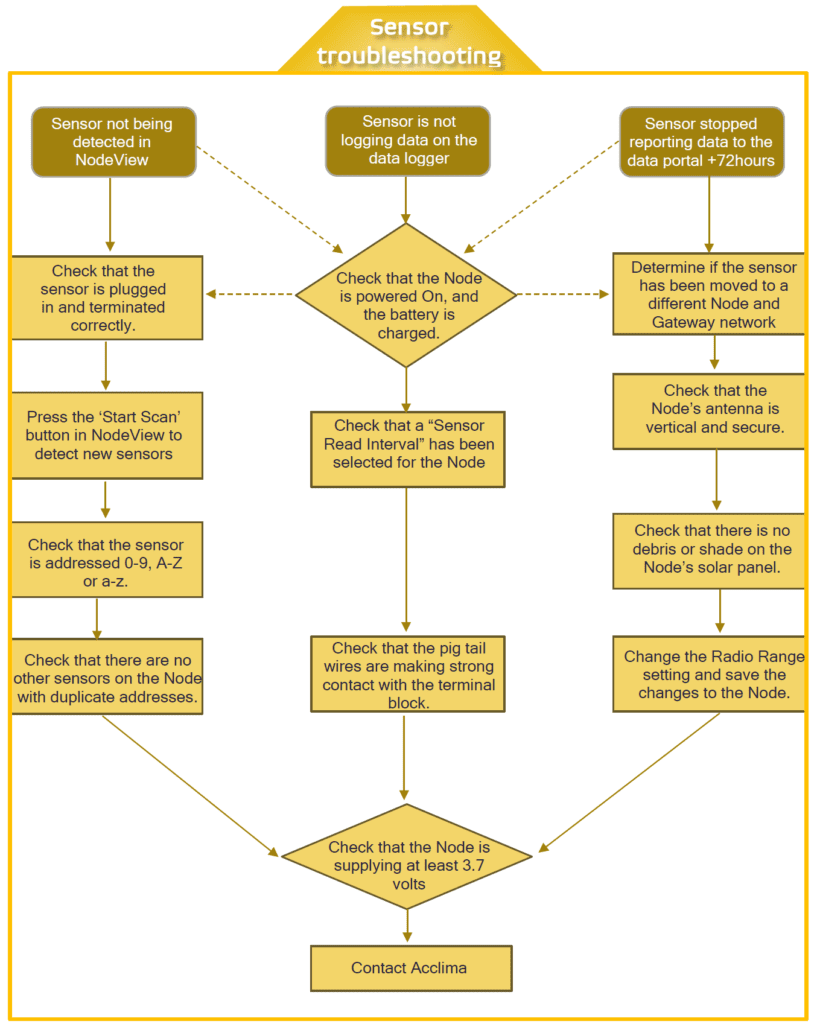
Uninstalling NodeView
To uninstall NodeView, you may use either the setup utility or you can locate NodeView in your control panel.
Uninstall with Setup Utility
- Double-click the installer for NodeView.
- Select “Remove NodeView.”
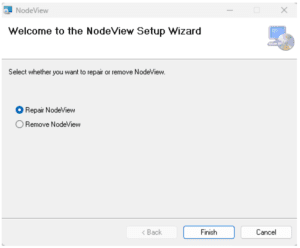
Note: The ‘Repair NodeView’ option should only be used if NodeView fails
to launch after attempting to open it. It will reinstall the application while keeping the settings intact.
Uninstall with Control Panel
- Open the ‘Control Panel application.
- Click ‘Uninstall a Program.
- Search for ‘NodeView’ in the list of installed applications.
- Select ‘NodeView’ and click ‘Uninstall.’
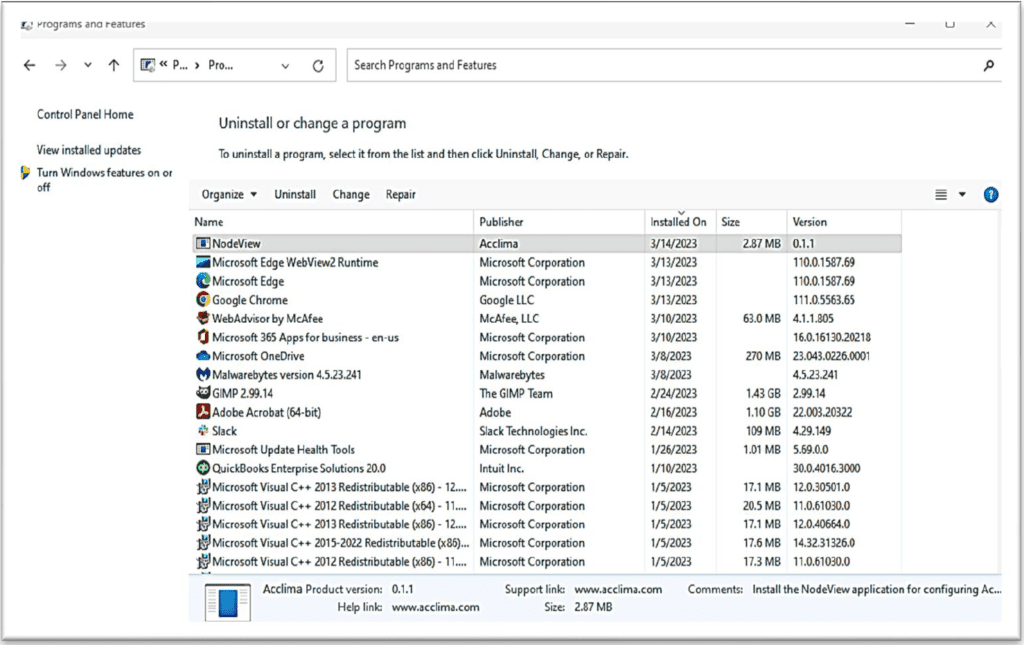
Updating a Node or Gateway
Manually Updating Firmware
When an update has been made available at acclima.com, it can be downloaded from the website and installed manually into a Node or Gateway. The Node will only accept compatible files and will load files that are incompatible with the hardware selected.
- Click “Actions” and select [Manually Update Firmware].
- Connected devices should appear in the field on the left. Select the available “Com Port.”
- When selected details of the device will appear in the “Port Information” Section.
- Click “Select Update,” and File Explorer will appear, locate where you have
extracted the update file, and click [Open]. - Select [Apply Update]. A progress bar will appear and complete the update.
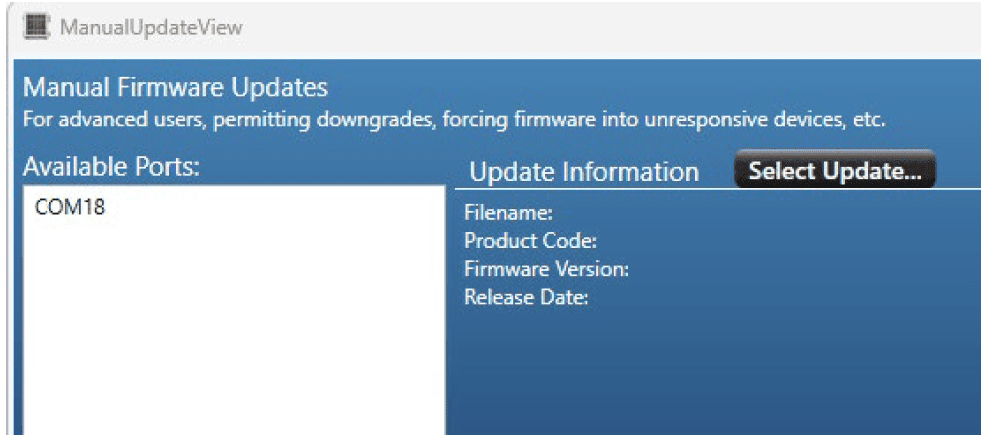
- Click close Updates Window.
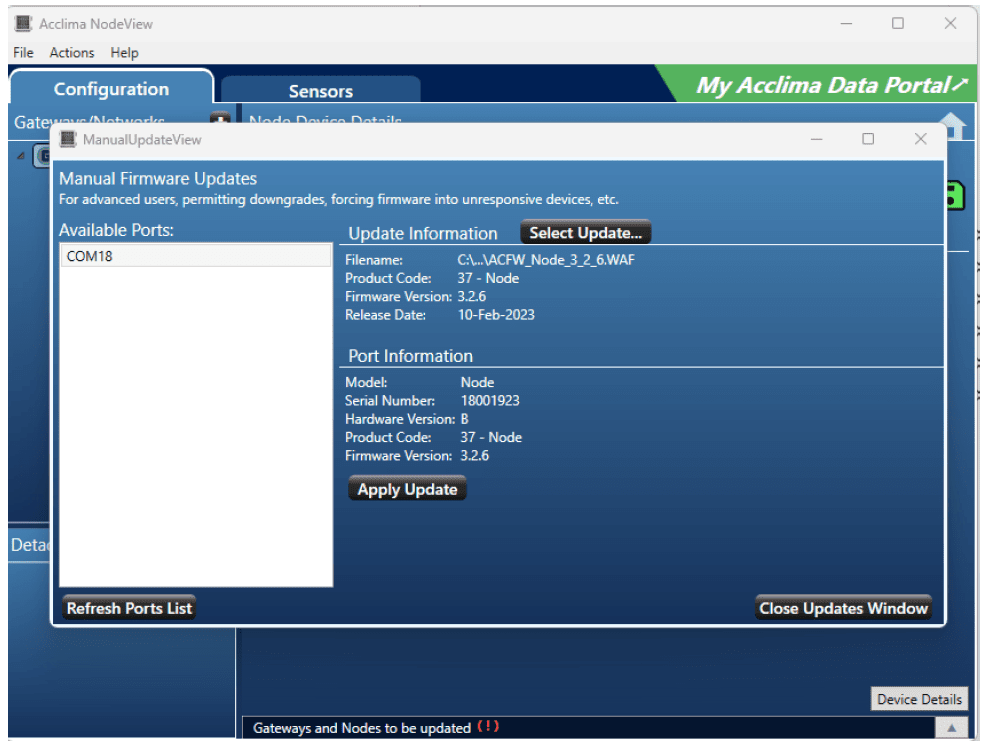
Note: If the update fails close NodeView and retry the update process.
Terminal Commands
A command line interface can be used to communicate directly with the Nodes. To enable the device terminal, make sure the advanced settings have been enabled in the action menu. Click the Advanced Settings tab and click the ‘Hidden’ button to the right of the “Device communication terminal” option to make the option ‘Visible.’
Talking with sensors directly:
[With a Node connected and powered on.]
- On the Configuration page, click “Device terminal” to open the terminal.
- Type the command “SDITERM” which puts the Node into SDI-12 terminal mode.
Note: Typing “@Q” will exit SDI-12 terminal mode allowing you to type other
Node terminal commands.)
After putting the Node into SDI-12 terminal mode, any text you type will be sent to the SDI-12 bus. Now you must use SDI-12 commands because you are “talking” with the sensors attached to the Node.
- If only one sensor is attached to the node you can use the “?” symbol as a wildcard address.
- If multiple sensors are attached, you must already know their addresses and use that in your commands. All SDI-12 commands begin with the address of the device you are talking to and end with an exclamation point “!”.
Here is a quick example of several commands that you can use to identify and take a reading from a sensor:
Note: Each line prefixed with TX is the command sent, the response is prefixed
with RX. All responses from a sensor will start with its address.
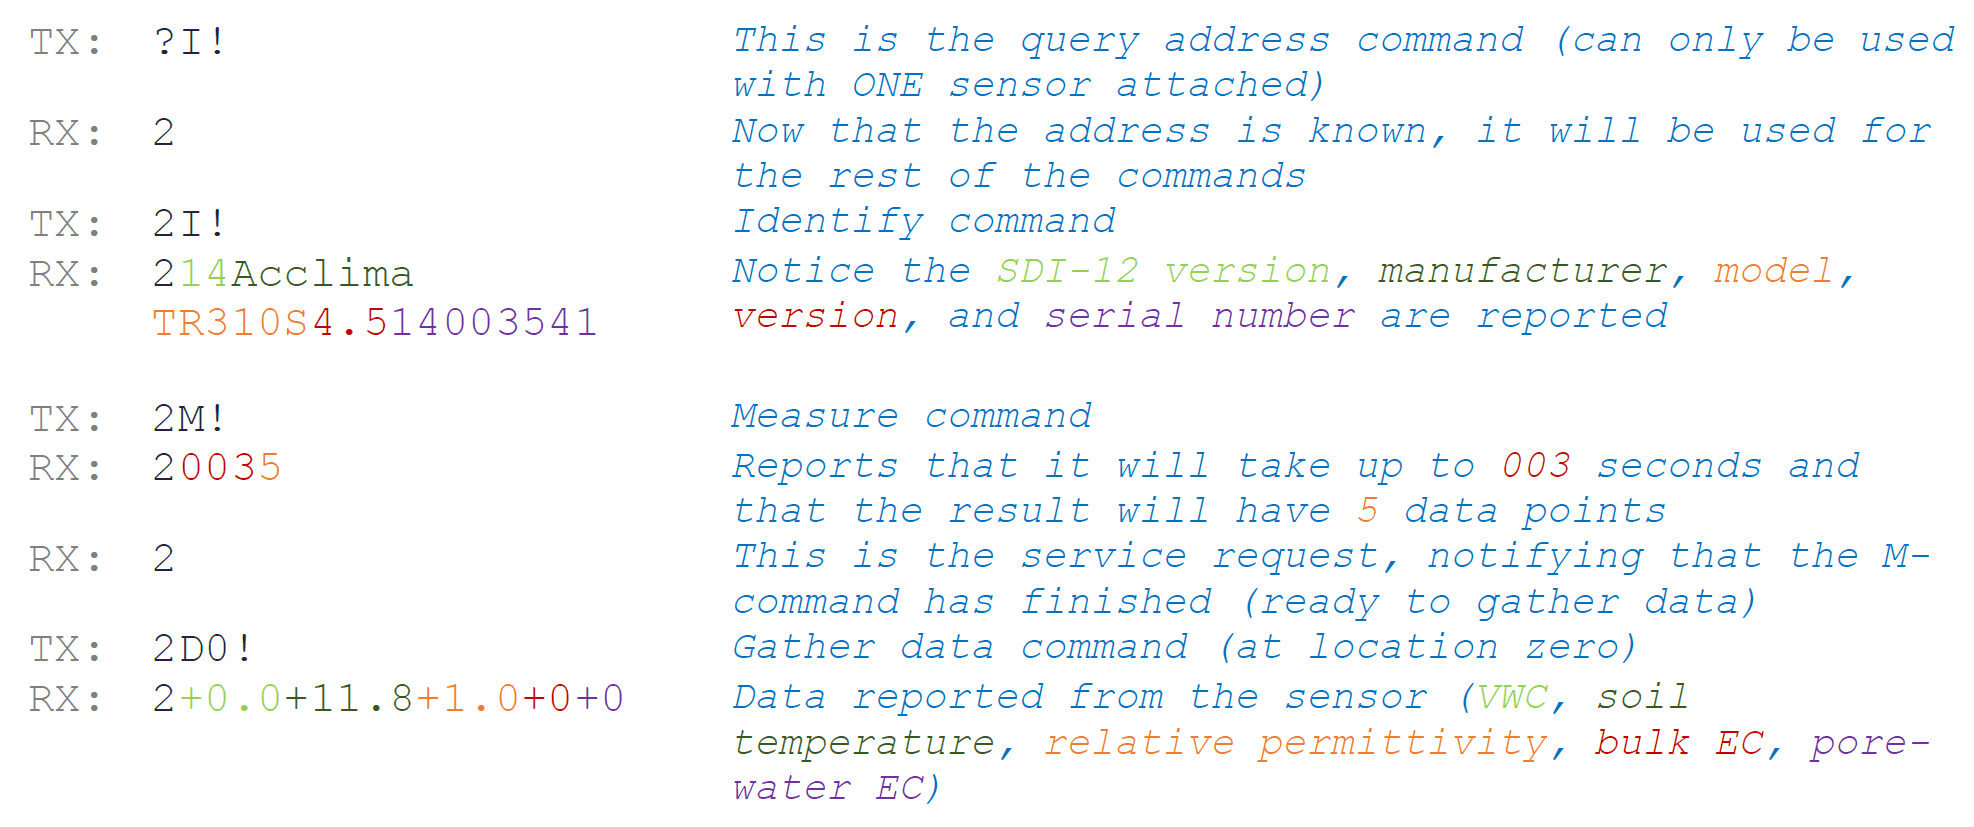
More information about the SDI-12 specification can be found here: https://sdi-12.org/specification
Log History Report:
Alternatively, another way to get instant data from the sensors is to force the Node to log a reading. This is a log that will be recorded at the time that you send the command (in other words, it will be reported immediately as well as show up in data reported to the Acclima server in addition to readings gathered at the regular interval). One benefit to this approach is that you will get readings from all the sensors connected at once (it automates scanning the SDI-12 bus and taking a reading from each sensor).
While using a terminal, send the command “LOG GET”. The Node should immediately begin scanning each possible address on the SDI-12 bus, starting at ”0” and going through uppercase and lowercase alpha and finally ending on “z”. For addresses that it has found a sensor, it will report “+”, for all other addresses it will report “-“. After scanning the bus, it may take several seconds to gather data from each sensor found. You should then see a report of the log generated, something like this:
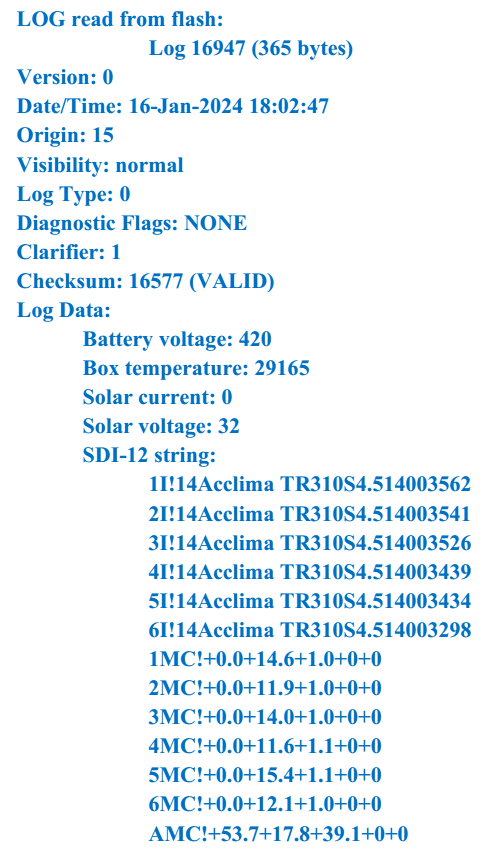
Log Report Detail
Things to note about this log report:
- The log number or LogID is reported on the first line as well as how much memory the data requires.
- The timestamp is always recorded in UTC.
- Box readings are also included:
- battery voltage (centi-volt)
- box temperature (centi-Kelvin)
- solar current (milli-ampere)
- solar voltage (centi-volt)
- The SDI-12 strings are reported with the command that generated the data prefixed to it.
- The address is included with the command, but it is not repeated in the response data (to save space).
- The data follows the command immediately (therefore anything after the exclamation point is data).
- A new line separates command-result pairs – each reading will be on its own line.
- If the sensor is detected new at the address, it will have the result of the Identify command included in the log.
- In the example included above, addresses 1 – 6 were detected new but address A was not.
- If the M command has a “C” following it, this means that the SDI-12 CRC option was used to help validate the reading (the CRC is discarded after having been verified therefore you will not see it attached to the data).
- The CRC option is enabled by default but can be removed using Advanced Settings in NodeView.
Historical Data
You may also want to see historical log data. This can also be done through a terminal.
- To see the most recently recorded log, type the command “LOG PRINT” and press Enter.
- To see the first and last logs currently stored in the Node (to thereby determine the range of logs) Type the command “FLASH INFO” and press Enter.
- You can also print a specific log if it is currently stored in flash memory by sending command “LOG PRINT <log number>.”
Preventative Maintenance
Using the procedures described in the documentation, it is possible issues may come about if care is not given to the system to prevent certain occurrences. Adhere to the following guidelines to best prevent frequent issues and maintain good health of the Acclima Solar Node and Gateway system.
Regular Inspection: Perform routine visual inspections of the sensors and data loggers. Check for any signs of damage, corrosion, or wear and tear. Address any issues promptly to prevent further damage. Check to ensure that antennas remain in their vertical position and no obstructions have been added that may add additional attenuation to a radio signals’ path.
Cleaning: When necessary, keep the data loggers clean of dirt, debris, and any other contaminants that may interfere with their operation. When conditions arise that call for sensor cleaning, exhume the sensors, and use a soft brush or cloth to gently clean the sensor rods and body. Always reinsert the probes back into the target media using the probe guide insertion tool to prevent splaying of the rods.
If the quality of the waveguide rods appears to be changing, using heavy duty cleaners like Calcium, Lime, and Rust (CLR) removers can be incredibly helpful. Metal wire brushing should only be used when removing difficult incrusted debris forming on the waveguides. Factory recalibration of Acclima probes may not be required as long as the waveguide rods remain undamaged, unbent, and oxidization and calcification after use in high EC media conditions.
How to Clean Sensors:
- Unplug the sensor from power, and its data logger.
- Rinse the sensor with soapy water.
- Use a course brush to wipe away any clinging debris.
- If deposit build up has occurred on the rods, let the sensor relax in a CLR bath for about 2-3 minutes, then scrub with a metal wire brush until the sensor rods are smooth to the touch.
- Rinse the sensor with soapy water again to remove any chemicals from the waveguides.
- Air dry or wipe down the sensor with a rag and reinsert it into the media when ready to restart data logging.
Secure Mounting: Ensure that the sensors and data loggers are securely mounted in place to prevent accidental damage or displacement due to wind, animals, or human activity.
We strongly recommend the following:
- Use of plumber’s putty/filler, to seal any large opening that may be found on the Node or Gateway logger. Especially at the neck opening inside the Node-Gateway enclosures.
- Use of humidity absorbing silica gel packs inside the Node-Gateway enclosures to absorb any excess condensation that may form inside and remember to replace them every 3-6 months.
Warranty
Acclima Products Limited Warranty Policy
- Our warranty strictly covers manufacturing defects in materials and workmanship in products. The warranty is valid from the date of purchase by the original purchaser and for a period of 24 months.
- Exclusions: A) Damage or failure caused by abuse, misuse, faulty installation, and operation, improper or inadequate maintenance, and any repair not conducted by Acclima. B) Damaged resulting from inadequate packaging or carrier mishandling. C) damage incurred by lightning or catastrophic natural disasters such as floods, earthquakes, tornados, hurricanes, or fires. E) Damage incurred from acts of war, of force majeure.
- It is the original purchaser’s responsibility to provide dated proof of purchase. The warranty is not transferrable.
- Acclima will at its sole discretion repair or exchange a product under warranty. No credit will be issued.
- The warranty is void when: a) the product serial number has been altered or removed. B) the product has been altered, serviced, or manipulated by anyone other than Acclima or without the prior written authorization of Acclima.
- All shipping charges must be pre-paid by the sender. We will ship ‘best way’ at our discretion.
- Service and repairs: Contact support@acclima.com or call 866-887-1470. To request a return authorization number RMA. Do not send a product without first securing an RMA#.
Log
Rev. 1 Change Log
April 2023.
Additions: Describes all features available at product release.
March 24, 2024
- Added LED Status mode chapter
- Added Graphs chapter
- Added Device terminal chapter
- Added NodeView Log Report Detail chapter
- Overhauled installation instruction details
June 4, 2024
- Added Trouble Shoot Com Port section
August 22, 2024
- Viewing/Downloading Logs