Download the PDF Version of this Data Sheet
Click this link to download the data sheet.
Table of Contents
Description
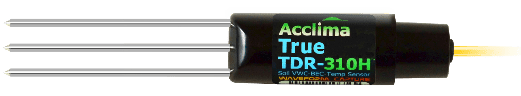
The TDR-310H is one of Acclima’s H-series sensors, which are very low power and suited perfectly for power-conscious applications. Being part of the Soil Smart Series means that it’s advanced waveform analysis works with all mineral soil types. It is a complete integrated time domain reflectometer that combines ultra-fast waveform generating and digitizing functions with a precision 5 pico-second resolution time base and highly sophisticated waveform digitizing and analyzing firmware that provides true time domain analysis of soil-propagated waveforms.
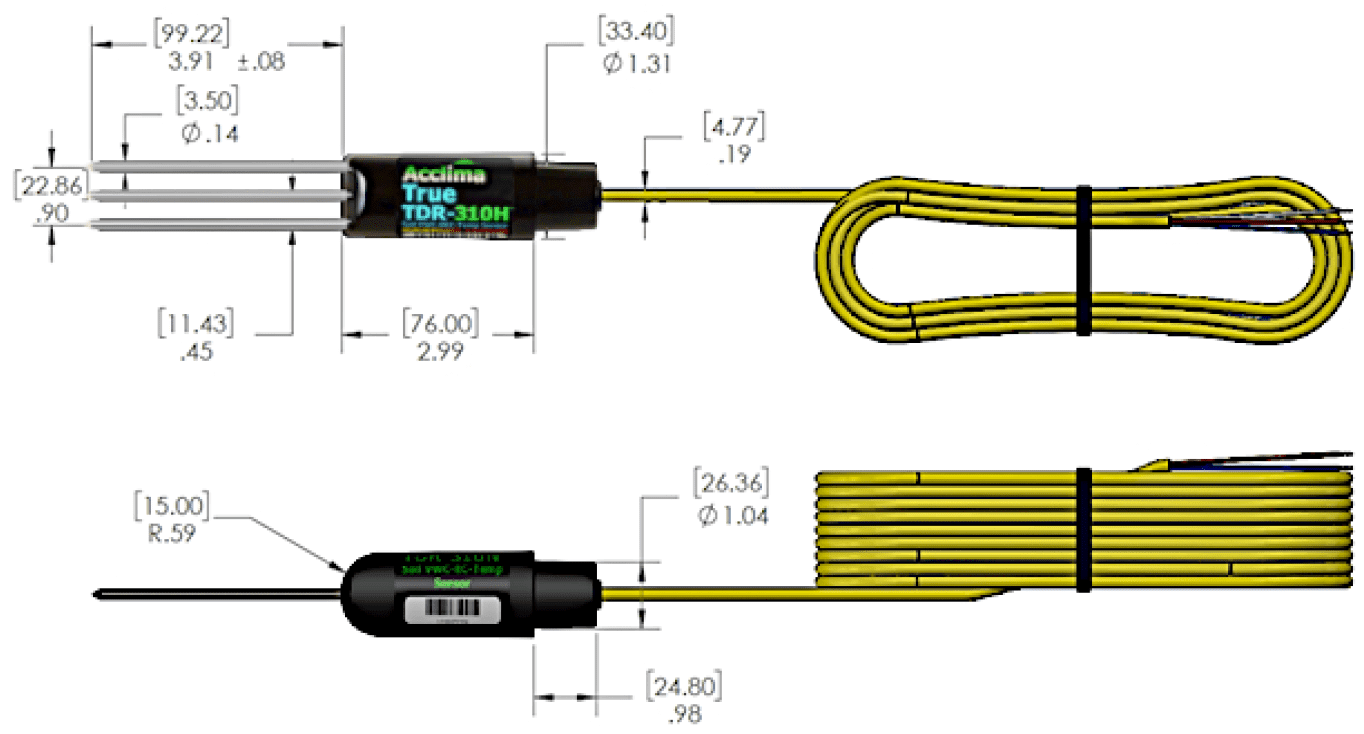
Its form factor is designed for easy vertical installation in an augered hole using a 34 mm flat-bottomed auger. It mates with a 1” schedule 40 PVC pipe that acts as a handle in its installation to any desired depth. It provides reading data through a 3-wire SDI-12 interface and is compatible with any data recorder that is compliant with SDI-12 version 1.4 and earlier.
Its main improvements over the ‘310S are its faster rise time, its shaped incident wave, its lower power consumption and its very fast response time.
Features
- Ultra-low power consumption and fast response time
- Housing designed for easy bore hole installation at any depth
- Soil Smart analysis works with all mineral soil types
- Incident Wave Amplitude: 400mV
- 20% to 80% Incident Wave Rise Time: 150 ps
- Waveform Digitizing Resolution: 5 ps
- SDI-12 Interface
- 3-element 10cm stainless steel waveguide
- 5m or 10m 3-conductor waterproof cable (standard)
- Waterproof Epoxy-filled Housing
Measurement Functions
- Volumetric Water Content: 0% to 100%
- Medium Permittivity: 1 to 80
- Medium Bulk Electrical Conductivity: 0 to 2000 µS/cm
- Medium Temperature: -40 to +55 degrees C
- Pore Water EC (Hilhorst Model): 0 to 55000 µS/cm
Measurement Performance
| Parameter | Min | Max | Units |
| RELATIVE PERMITTIVITY | |||
| Range | 1 | 85 | – |
| Resolution | 0.1 | – | |
| Repeatability (RMS deviation) | 0.14 | – | |
| Accuracy | -2 | +2 | %FS[1] |
| Stability with Bulk Electrical Conductivity (0-3000 uS/cm) | -1 | +1 | %FS |
| VOLUMETRIC WATER CONTENT (VWC) | |||
| Range[2] | 0 | 100 | % |
| Resolution | 0.1 | % | |
| Repeatability (RMS deviation) | 0.3 | % | |
| Accuracy | -3 | +3 | %FS |
| Stability with Bulk Electrical Conductivity (0-2000 uS/cm) | -1 | +1 | %FS |
| TEMPERATURE[3] | |||
| Range | -40 | +55 | °C |
| Resolution | 0.1 | °C | |
| Repeatability (RMS deviation) | 0.01 | °C | |
| Accuracy (+5 to +35 °C) | -0.25 | +0.25 | °C |
| Accuracy (-15 to +55 °C) | -0.5 | +0.5 | °C |
| BULK ELECTRICAL CONDUCTIVITY (BEC) | |||
| Range | 0 | 2000 | uS/cm |
| Resolution | 1 | uS/cm | |
| Repeatability (RMS deviation) | 3 | uS/cm | |
| Accuracy (0 – 1000 uS/cm) | -25 | +25 | uS/cm |
| Accuracy (1000 – 2500 uS/cm) | -2.5 | +2.5 | % |
[1] Percent Full scale, i.e., +/- 2 percentage points.
[2] VWC is calculated based on relative permittivity using the formula derived by Topp with minor modifications toallow readings in slurries and pure water. The relative permittivity of water varies with temperature, so to see a reading near 100%, the sensor must be fully immersed in water long enough to equilibrate temperature with the water. The water should be at 20.5C with at least 4cm of water around the rods on all sides, beyond the tips of the
rods, and at least 1cm of the sensor body immersed. VWC readings higher than 100% are possible when the permittivity is higher than 80.
[3] The temperature sensing element is located next to one of the outer waveguide electrodes.
Absolute Maximum Ratings
Stresses beyond those specified below may cause permanent damage to the sensor. These are stress ratings only and operation at these levels is not implied.
| Parameter | Min | Max | Units |
| Supply Voltage (Measured between the red and white wires) | -16 | +16 | Volts |
| SDI-12 Data Voltage (Blue-White wires) | -16 | +16 | Volts |
| External Voltage Applied to sensor rod | -0.3 | +4 | Volts |
| Electrostatic discharge, center rod | IEC 61000−4−2 (ESD) | ||
| Storage Temperature | -40 | +60 | °C |
| -40 | +140 | °F | |
Operating Conditions
| Parameter | Min | Max | Units |
Operating Supply Voltage | +3.5 | +15 | Volts |
| Operating Temperature (VWC errors due to ice) | -30 | +55 | °C |
| Operating Temperature (VWC accurate, no ice allowed) | 0 | +55 | °C |
| POWER CONSUMPTION | |||
| Idle Current (sensor powered but inactive, 20 °C) | < 10 | uA | |
| Idle Current (-35 to +50 °C) | < 50 | uA | |
| Sensor read time | 0.25 typical | sec | |
| Sensor read current (Supply Voltage = 12V) | 36 typical | mA | |
| Sensor read current (Supply Voltage = 7V) | 88 typical | mA | |
| Sensor communications current | 6 typical | mA | |
SDI-12 Data Line Electrical Characteristics
| Parameter | Min | Max | Units |
| INPUT (when sensor is idle or receiving data) | |||
| Resistance to GND | 160k | 175k | Ohms |
| VIL (required input voltage in “marking” state) | -1 | 1.3 | V |
| VIH (required input voltage in “spacing” state) | 3.2 | 6 | V |
| OUTPUT (when sensor is transmitting data) | |||
| Output impedance | 1000 | 1250 | Ohms |
| VOL (output voltage in “marking” state) | 0 | 0.25 | V |
| VOH (output voltage in “spacing” state) | 4.7 | 5.2 | V |
Physical Characteristics
| Dimensions (without cable) | 20 cm x 3.3 cm |
| Weight (without cable) | 132 g |
| Cable weight | 32.7 g/m |
| Composition | 316 Stainless Steel, Epoxy, ABS Plastic |
| Cable | 3 copper conductor, 22 Ga., waterproof and UV resistant PVC jacket, 4.8mm overall diameter |
| Communication Protocol | SDI-12 Version 1.4 |