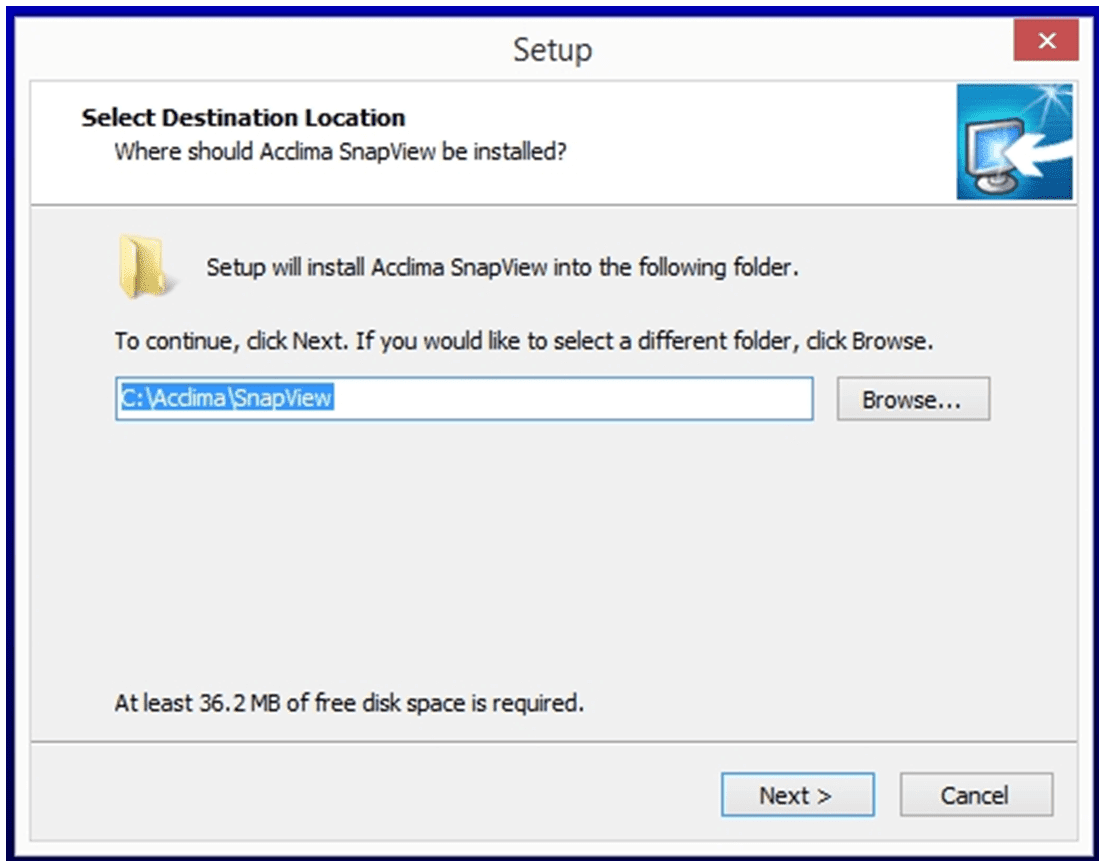
Using Acclima SnapView Software
The Acclima SnapView software provides four important functions:
- DataSnap configuration – configuring a DataSnap for operation
- Automatic data synchronization – data retrieval from all connected DataSnaps
- Manual sensor reading – user-initiated sensor readings
- Data analysis – synchronized sensor data analysis
Configuration
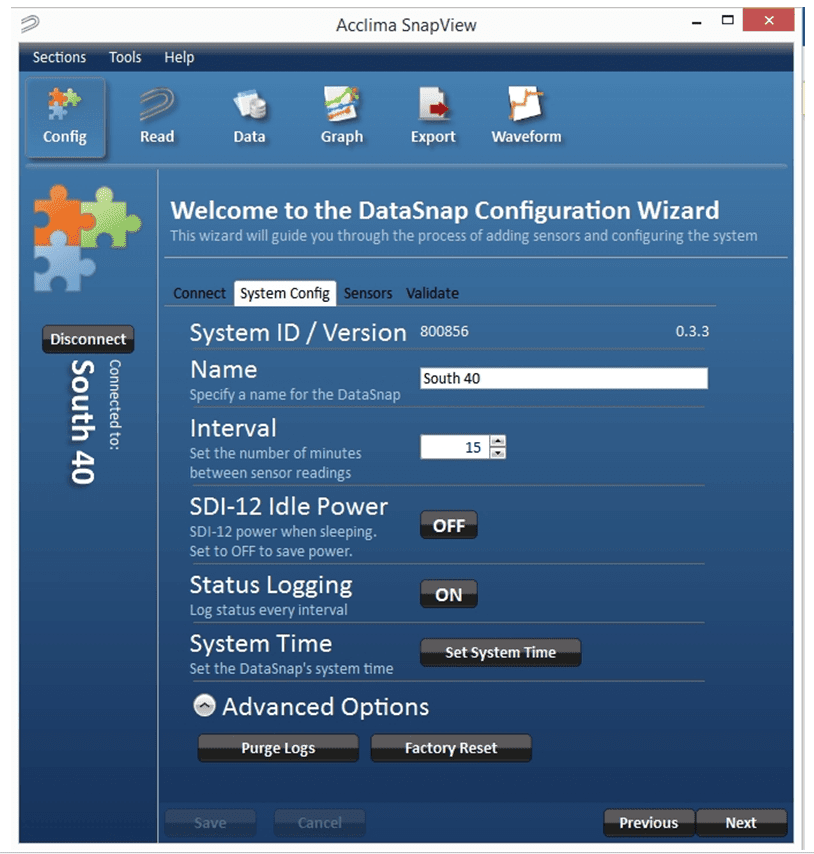
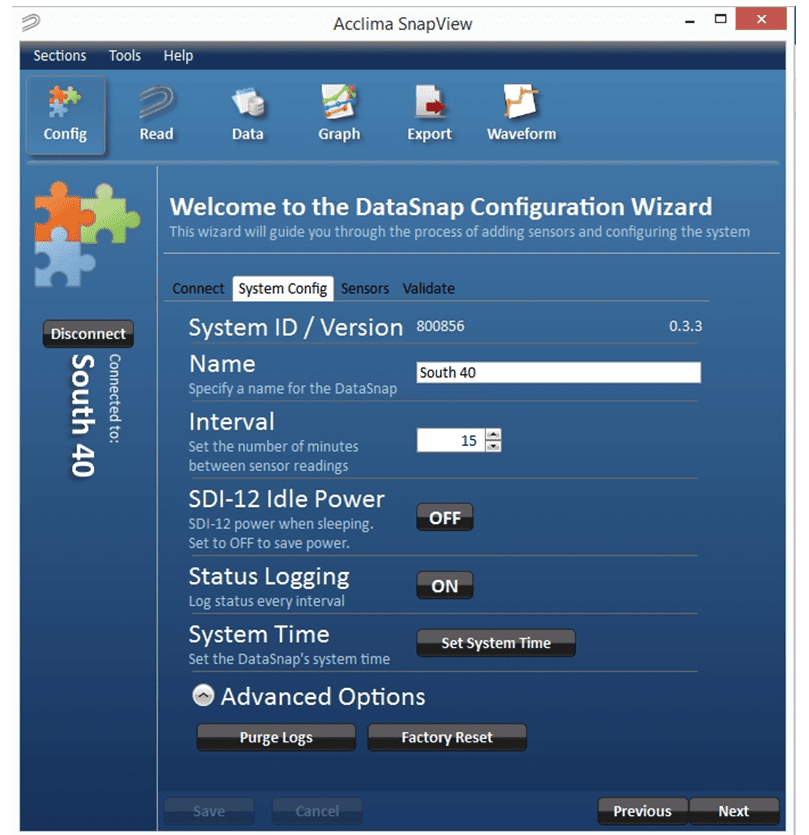
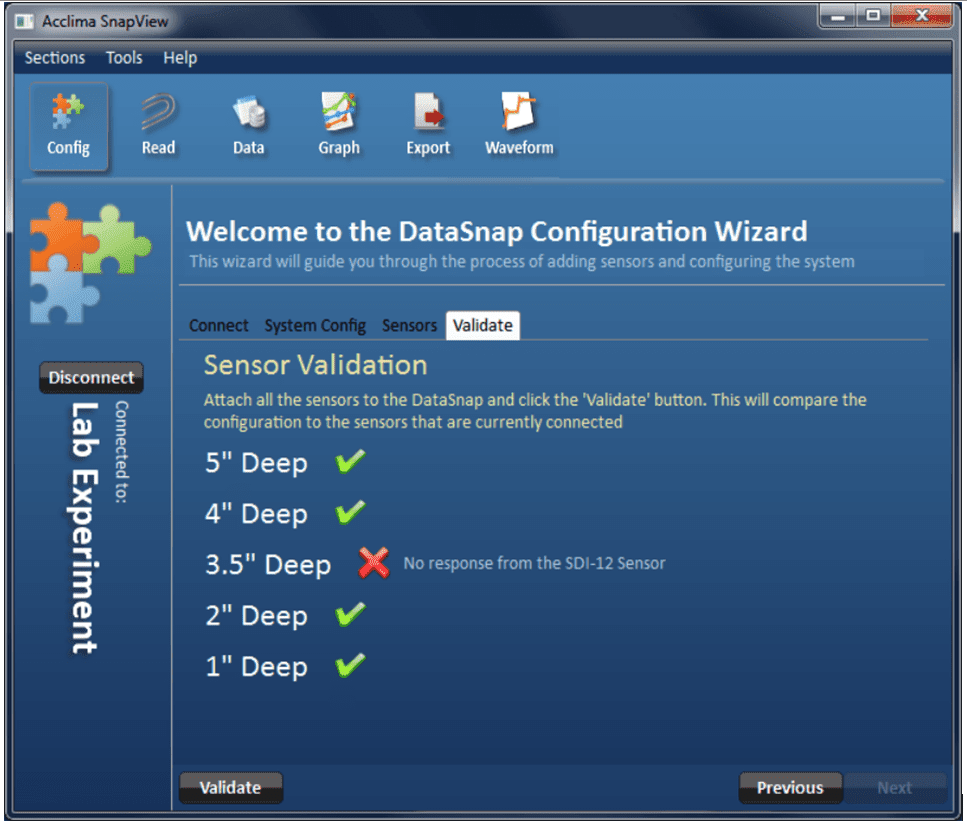
![]() A DataSnap must be configured prior to its first use. The SnapView software guides you through the configuration process in a few simple steps. To access the Configuration screen, click on the ‘Config’ button at the top of the screen. This will display the Configuration wizard.
A DataSnap must be configured prior to its first use. The SnapView software guides you through the configuration process in a few simple steps. To access the Configuration screen, click on the ‘Config’ button at the top of the screen. This will display the Configuration wizard.
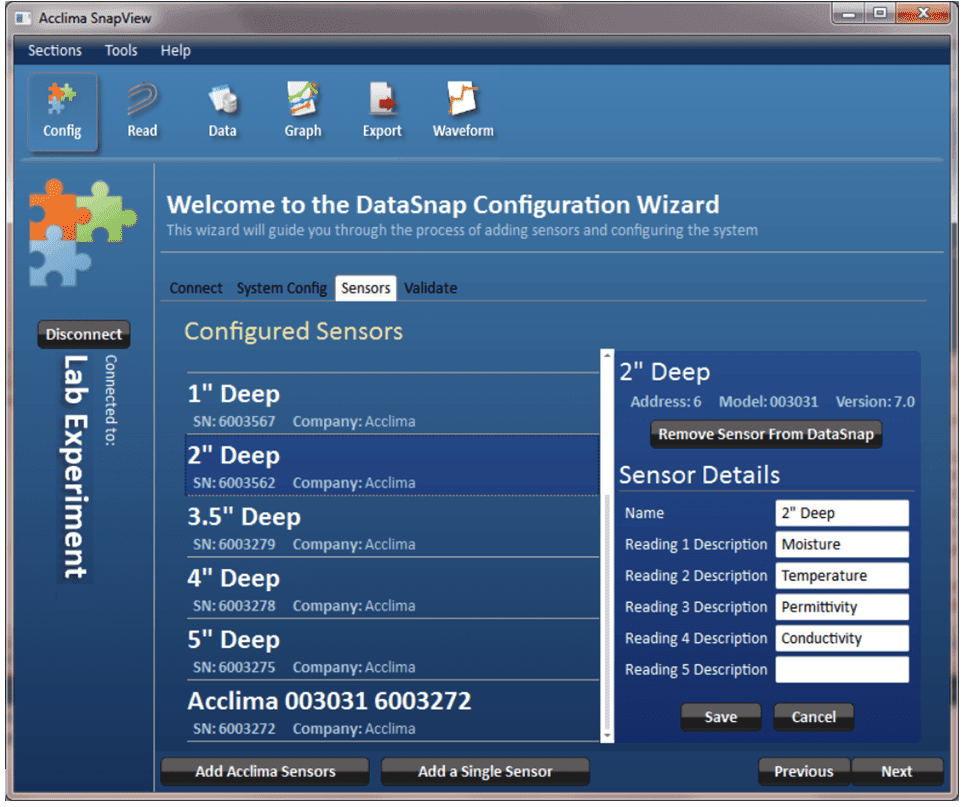
The SDI-12 protocol requires that a sensor be given a specific address. All communication with a sensor is based on this address. When a sensor is added to a DataSnap, the sensor’s address is stored in the DataSnap. This is how the DataSnap knows which sensors to read. It is important to understand that if a DataSnap has been configured and is then connected to a different set of sensors, the configuration must be changed accordingly. If this is not done, data from two sensors may become merged and there will be no way to know which reading came from which sensor. This can occur when a sensor from the original set and a sensor from the new set share the same address. The DataSnap reads sensors by address (an SDI-12 limitation) and returns data for the serial number of the configured sensor. The DataSnap does not know that the sensor is not what was originally configured. Performing a sensor validation can assist with this.
If one or more DataSnaps are connected via a USB port, the SnapView software will automatically find each DataSnap, connect to it and retrieve all of its configuration and sensor readings. This data is saved on the PC and is available for analysis in SnapView.
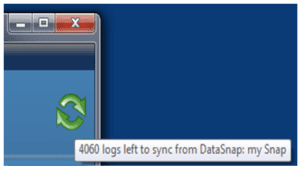
While the SnapView software is downloading sensor readings from a connected DataSnap, user actions such as reading sensors and saving a new configuration to that DataSnap are still allowed. If these interruptions occur, the download will be temporarily suspended for up to 1 minute before automatically resuming again. While the synchronization is interrupted, the green status icon will stop spinning.
Read Sensors Manually
 Each DataSnap can accommodate up to 10 sensors. The connected sensors can be manually read at any time. Prior to reading any sensor, the sensor must be connected to and configured on the DataSnap. This is a one-time process and is covered in detail in the ‘Configuration’ section. Manual readings do not occur automatically and are not saved for historical analysis.
Reading Sensors
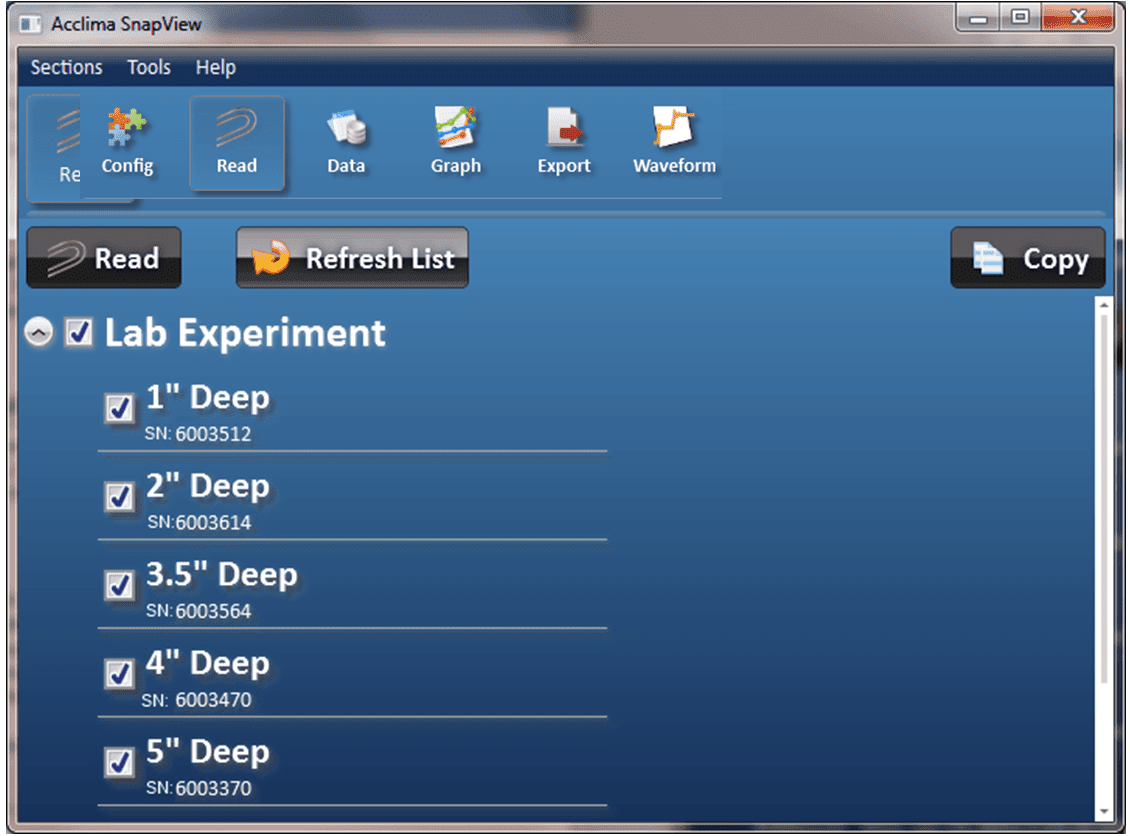
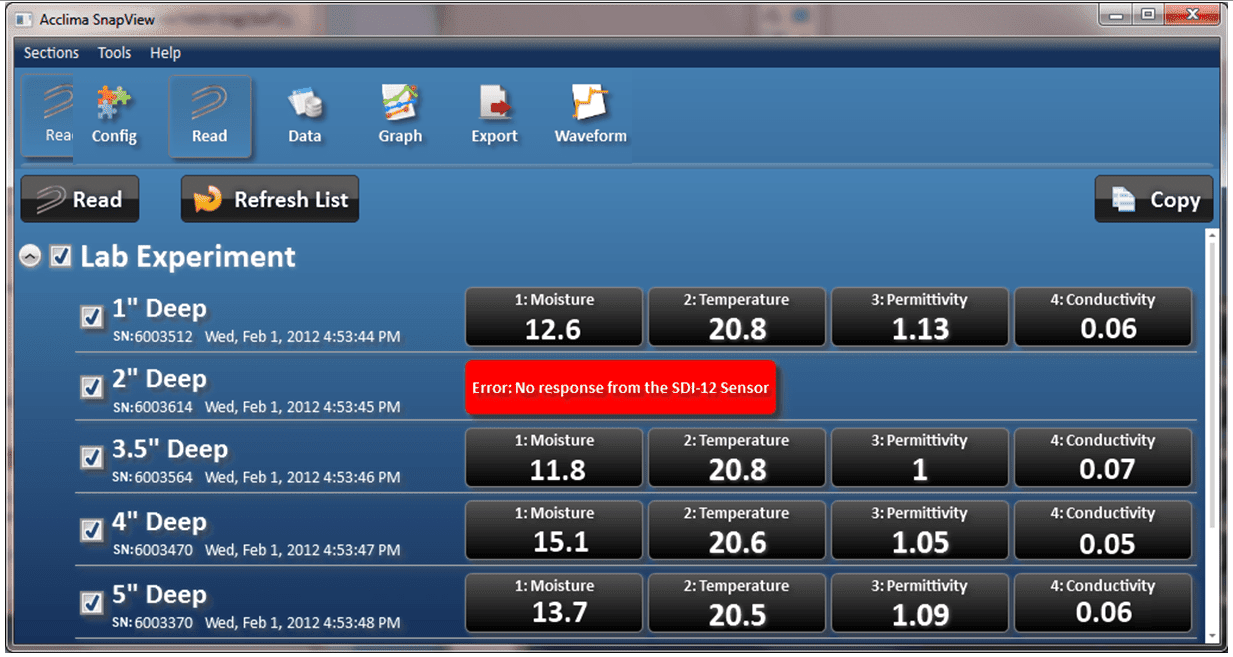
Click the ‘Read’ button at the top of the screen. A list of all connected DataSnaps and their configured sensors is displayed as seen in Figure 15. By default, each DataSnap and each sensor is selected. This is denoted by a check mark next to the name. Each time the ‘Read’ button is clicked, all selected (ie: checked) sensors will be read and the data displayed. To select or deselect all sensors on a DataSnap, click the checkmark next to the DataSnap’s name. To expand/collapse the list of sensors, click the gray circle or click the DataSnap’s name. Individual sensors can be selected/deselected by clicking the checkmark next to the sensor name.
Copying Sensor Data
Click the ‘Copy’ button to copy all sensor data to the Windows™ clipboard in a comma delimited list, one line per sensor. This allows the sensor data to be easily pasted into any Windows™ application.
View Graphs
 Sensor readings for all sensors can be viewed visually through the ‘Graph’ screen. To see the ‘Graph’ screen, click on the ‘Graph’ button at the top of the screen. The graph view allows access to the historical data of each DataSnap that has ever been connected to this PC. It does not require a DataSnap to be connected.
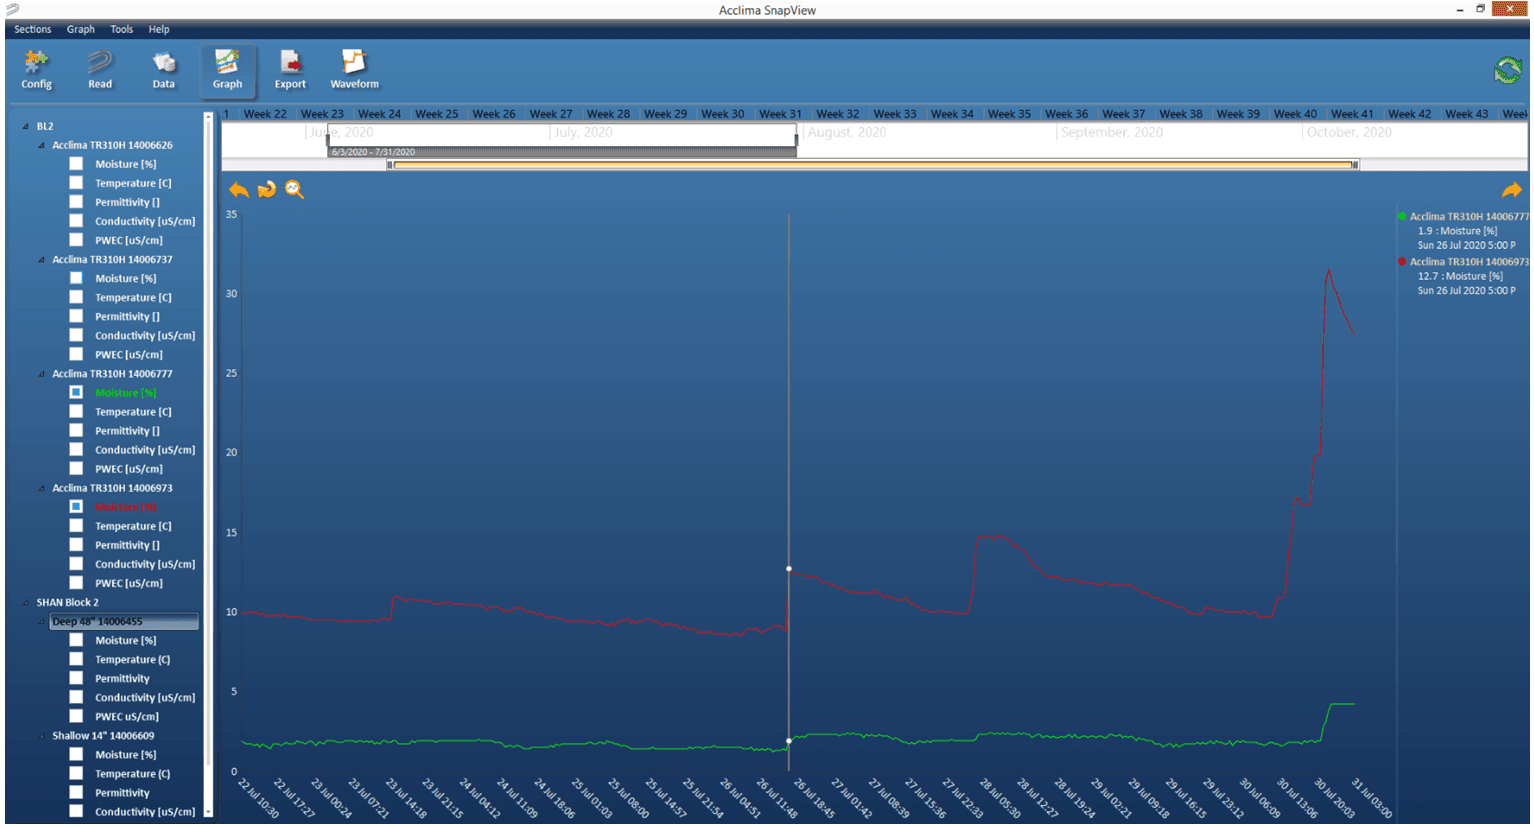
To view a different date range in the time bar, click the ‘Graph’ menu at the top of the screen.
- Main Graph – Each selected sensor reading will be displayed as a separate series in a unique color on the graph. If no data is displayed on the graph, it is likely because the date range specified in the time bar, falls outside the actual reading dates. To see details for specific readings, move the mouse around the graph. A gray vertical line will span all the visible series and a gray circle will be displayed at the intersection of the line and each series. The circle highlights the reading that is closest to the time indicated by the vertical bar. The highlighted readings are displayed in a legend to the right of the graph.
View Data
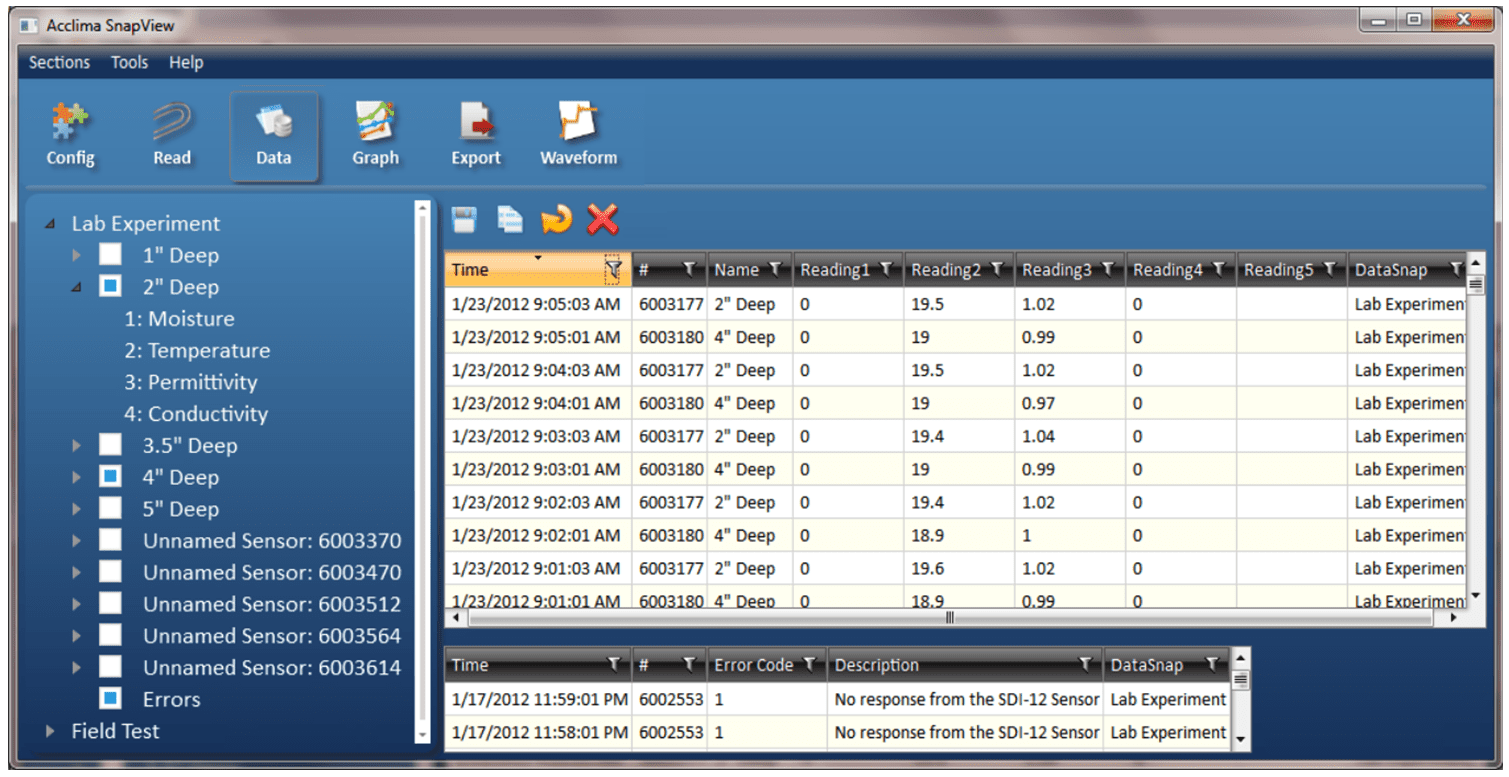
 Sensor readings can be viewed in a spreadsheet format in the ‘Data’ screen. Click on the ‘Data’ button to access the ‘Data’ screen. The data view allows access to the historical data of each DataSnap that has ever been connected to this PC. It does not require a DataSnap to be connected.
Select one or more sensors from the list to see the data in the grid.
Different types of sensors will have different types of data in each of the five readings therefore the column headers are named generically. To see the description of each of the sensor’s readings, click the sensor in the list at the left. The node will expand to show the description of each reading. Errors can be viewed by selecting the ‘Errors’ in the list to the left. Errors are displayed in a separate grid. When both grids are displayed, the grid size can be adjusted. To do this, hover the cursor over the horizontal border between the grids. The cursor will change to a vertical arrow. Click the left mouse and while holding down the left mouse button, drag up or down.
In Figure 23, two sensors have been selected. Those sensors are named ‘2” Deep’ and ‘4” Deep’. Their data is displayed in the grid to the right, sorted chronologically. The ‘2” Deep’ sensor has been expanded to show the names of its readings. The errors have also been selected and are displayed.
Options
There are several different operations that can be performed within the data screen. These are accessed via the options bar. They include:
 Save – save all the data in the grid to a comma delimited file.
 Copy – copy each selected row of data to the Windows™ clipboard. Click on any row in the grid to select it. To select multiple rows, hold down the Ctrl button on the keyboard and click on additional rows.
 Refresh – refresh the grid to show any new data readings.
 Delete – delete the selected rows
Sorting Data
To sort data in each column, click anywhere on the black column header. The data will now be sorted by that column heading. Clicking the header again will sort the column in the reverse order.
Filtering Data
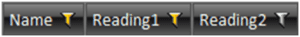
A filter may be applied to limit the amount of data displayed. Each column can be filtered and multiple columns may be filtered at the same time. To specify a filter for a column, click on funnel shaped icon ![]() in the header of the column. If the icon is white, no filter has been applied. If the icon is yellow, a filter has been applied.
in the header of the column. If the icon is white, no filter has been applied. If the icon is yellow, a filter has been applied.
In Figure 24, a filter has been applied for the ‘Name’ and ‘Reading 1’ columns but not the ‘Reading 2’ column.

The filter window displays a list of items that are available for display. Each item can be selected or not selected as desired. If an item is selected, it will be displayed in the grid. If it is not selected, it will be hidden in the grid. To select all items, click the ‘Select All’ option near the top of the filter window. Clicking the ‘Select All’ option a second time will deselect all items.
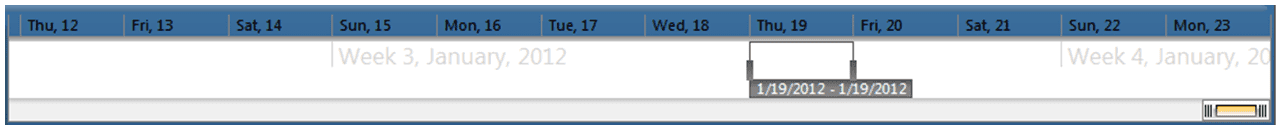
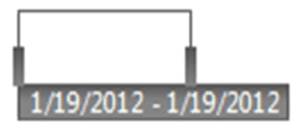
The list of items is dependent on the data in the column. Other custom filter criteria can be specified for complex scenarios. These are defined in the lower half of the filter window. These options allow range-based filtering. For instance, a filter could be set that displays all times between January 15, 2012 and January 18, 2012.
To remove the filter, click the ‘Clear Filter’ button.
Sorting Soil Moisture Sensor Data
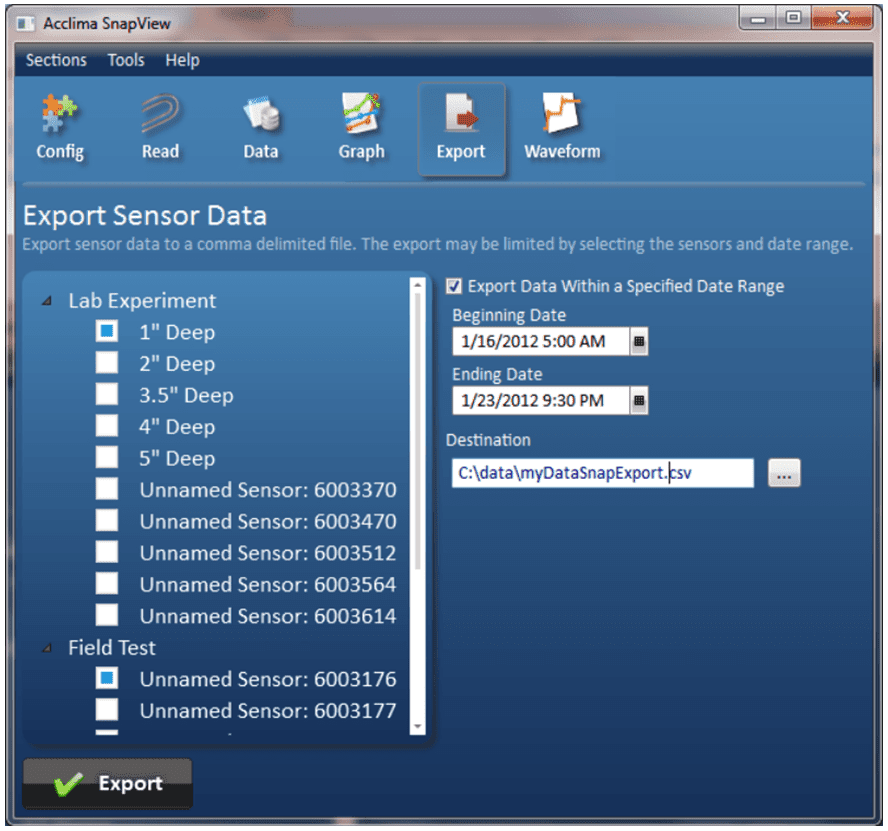
 Soil moisture sensor readings can be saved to a file in the Data screen. However, to export data on a larger scale, it is best to use the ‘Export’ screen. To see the ‘Export’ screen, click on the ‘Export’ button at the top of the screen. This will display the Export screen. This allows the option to export sensor data into other programs allowing greater flexibility and analysis of the data. You can export any of the data into other programs such as Microsoft ExcelTM.
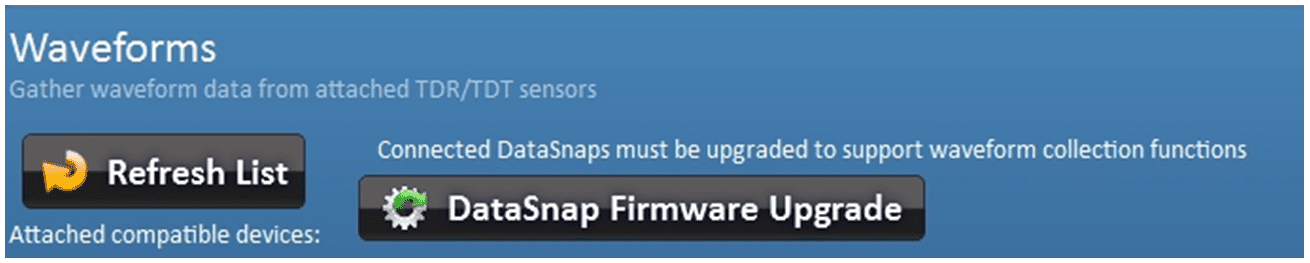

- This action will automatically connect the SnapView software to the USB-cable-attached Solar DataSnap or DataSnap data logger and will open the waveform capture module listing sensors configured to the data logger.
- If the PC goes to sleep, afterward you may not see the active sensors listed on the left and may need to click the ‘Refresh’ button.
- If connected sensors do not appear on the list, they may not be configured yet. Click the ‘Config’ button, click ‘Connect’, and then go through the process of adding sensors to your DataSnap.
- Note: If you left click the ‘Refresh List’ button the software will look for any newly connected and configured sensors attached to the DataSnap. If the desired new soil moisture sens
 or is immediately shown, you may left click the ‘Stop’ button to stop the list from refreshing further.
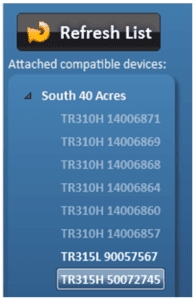
 - Select one sensor in the list by clicking on it. Any sensor in the list that is highlighted white, that sensor is currently connected and configured to the SDI-12 data logger. If the sensor is subdued in light blue, that is an indication that the sensor is not actively connected or communicating with the DataSnap, or that the sensor does not support waveform capture.
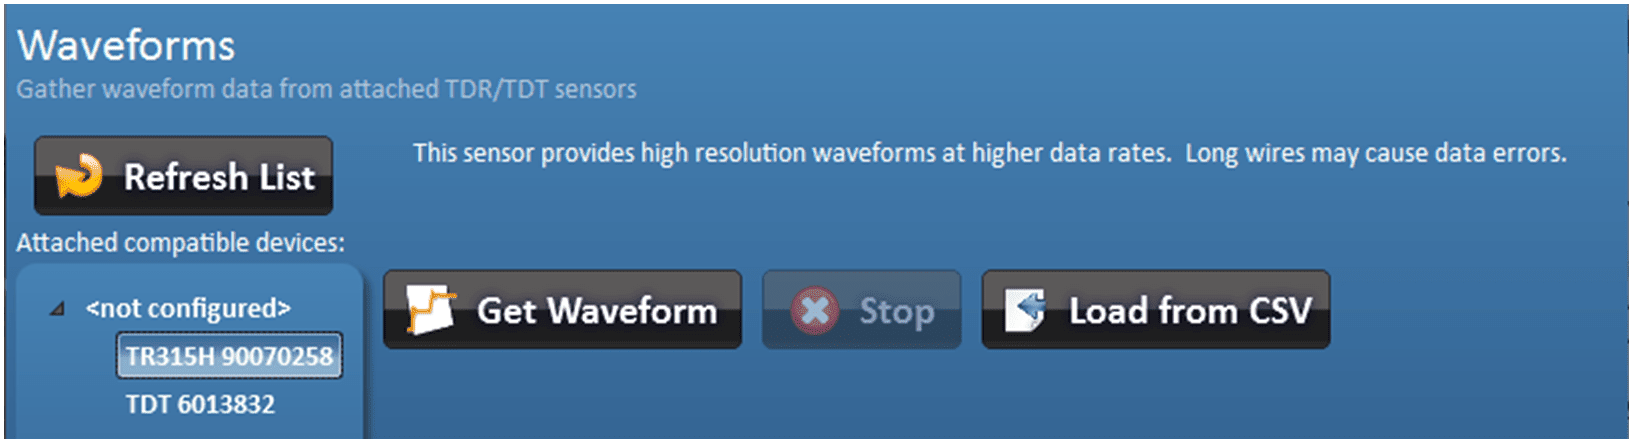
If you pull a waveform using an Acclima TDR that has “Waveform Capture” printed on the label, the entire waveform at full resolution should show up within several seconds of![]() clicking the ‘Get Waveform’ button.
clicking the ‘Get Waveform’ button.
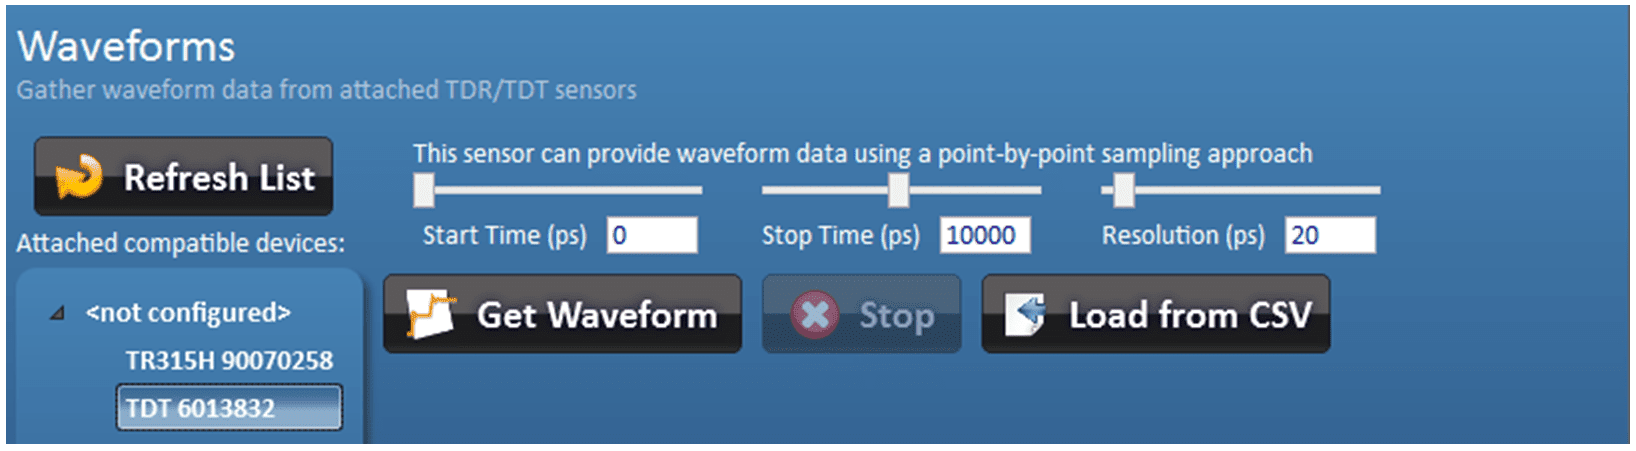
The start time, stop time, and resolution of the gathered data (in picoseconds) can be adjusted by moving the sliders or by entering the desired value in the boxes provided. All times are in 5 picosecond steps.
Once the desired parameters have![]() been entered, click the ‘Get Waveform’ button to begin the process.
been entered, click the ‘Get Waveform’ button to begin the process.
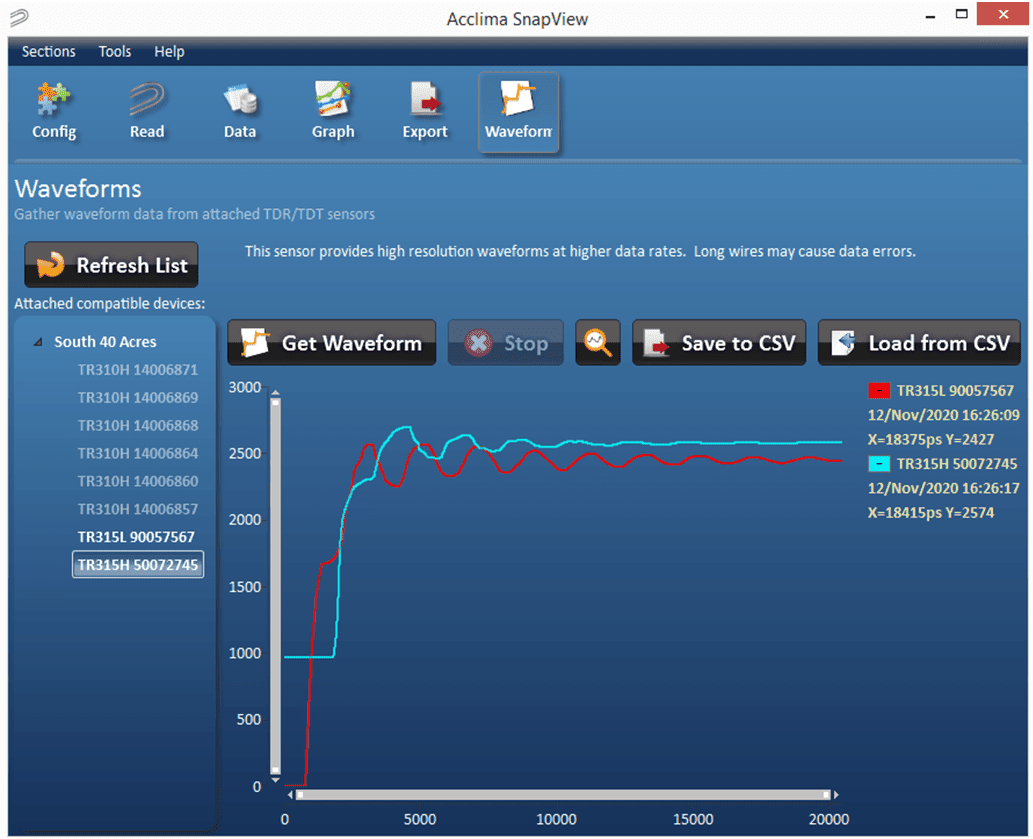
A waveform graph will then will begin to be generated similarly to the picture below, (time can vary from a few seconds to 15 minutes depending on whether you are getting a waveform from a sensor labeled with “Waveform Capture” or not):
Deleting a Waveform
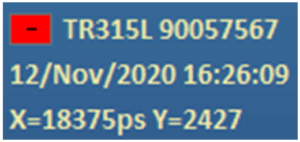
The minus within the colored (e.g., red) box in the legend can be used to delete the waveform when left-clicked with the mouse.
Zooming
The user can left click drag a square from upper left to lower right direction over a section of the waveform that needs closer inspection.  A zoomed-in presentation of that waveform section will appear after releasing the left mouse button. To reset the graph to the full view mode just left click the ‘Reset zoom’ (magnifying glass icon).
The X, Y axis can be lengthened or shortened with the mouse pointer by hovering the mouse pointer over the end of the X or Y scroll bar until a double ended arrow appears.
⇳ or ⬄
Pressing and holding the left mouse button at that point will grab the end of the scroll bar to allow lengthening and shortening of the scroll bar which zooms in and zooms out. Left clicking the ‘Reset zoom’ (magnifying glass icon) will return the graph to full view.
Saving to CSV File
A waveform or several waveforms can be exported![]() to a CSV file by left clicking the ‘Save to CSV’ file.
to a CSV file by left clicking the ‘Save to CSV’ file.
At this point the save dialog box will appear and you will have the ability to choose the folder in which to save the waveform information. You will also be able to change the name from the default. The default file name is ‘WaveformCollection_YYYYMMDD_HHMMSS.csv’, where YYYY is the year, MM is the month, DD is the day of the month, HH is the hour of the day in 24-hour format, MM is the minute, and SS is seconds – all indicating the date and time that the ‘Save to CSV’ button was pressed.
Loading from a CSV File
A waveform graph can be loaded from a CSV file by ![]() left clicking the ‘Load from CSV’ button.
left clicking the ‘Load from CSV’ button.
An open file dialog file will appear allowing you to navigate to the desired CSV file. Once selected, left click ‘Open’. The waveform(s) in the csv file will then be added to the current collection of waveforms already on display, up to a maximum of 12 waveforms. If the csv file contains more than 12 waveforms, manual deletion of row data may be required by the user to display waveforms further down the list.
The load function supports 2 CSV formats:
- CSV waveform files saved by the SnapView Software
- CSV waveform files saved by the Acclima SDI-12 Reader (RD1200)
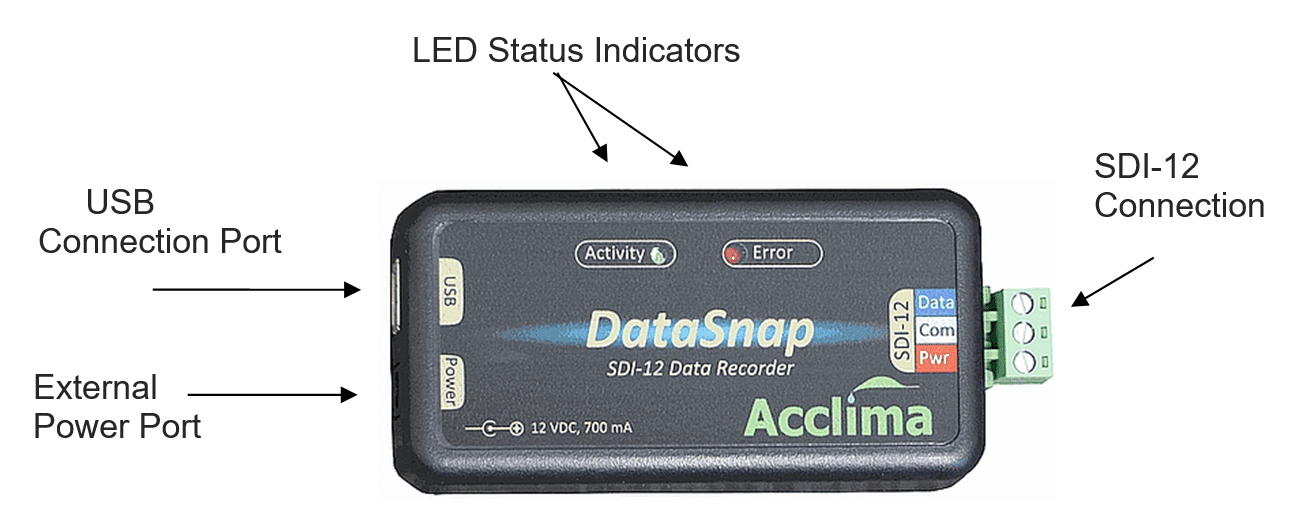
DataSnap Technical Specifications
Physical Characteristics
Length: 4.0” (10.3 cm)
Width: 1.9” (5.0 cm)
Height: 1.2” (2.75 cm)
Environmental
Operating Temperature: -20 to +60 °C (-4 to +140 °F)
Humidity: 0 to 90% RH, non-condensing
Electrical Specification
USB Port
Input Voltage: 5VDC, ±0.5V
Input Current: 700mA Max
External Supply Input (optional)
Input Voltage: 6-12VDC, 15V Absolute Max
Input Current: 700mA Max
Connector Type: 2.1mm barrel, center positive
SDI-12 Output
Signal Voltage: Typically 0-5VDC
Power Output Voltage: (Input Voltage) – 0.5V. Voltage may drop when short circuit protection is active
Short Circuit Current: 700mA ±20%
Power Consumption (12V External Power Supply)
35mA: USB Active, No Load/Sensors
8mA: USB Disconnected, Logger Active
1.1mA: USB Disconnected, Logger Sleeping, IDLE_POWER=ON (Output Active, No Sensors)
60uA: USB Disconnected, Logger Sleeping, IDLE_POWER=OFF (Output Power Off)
Developer Reference
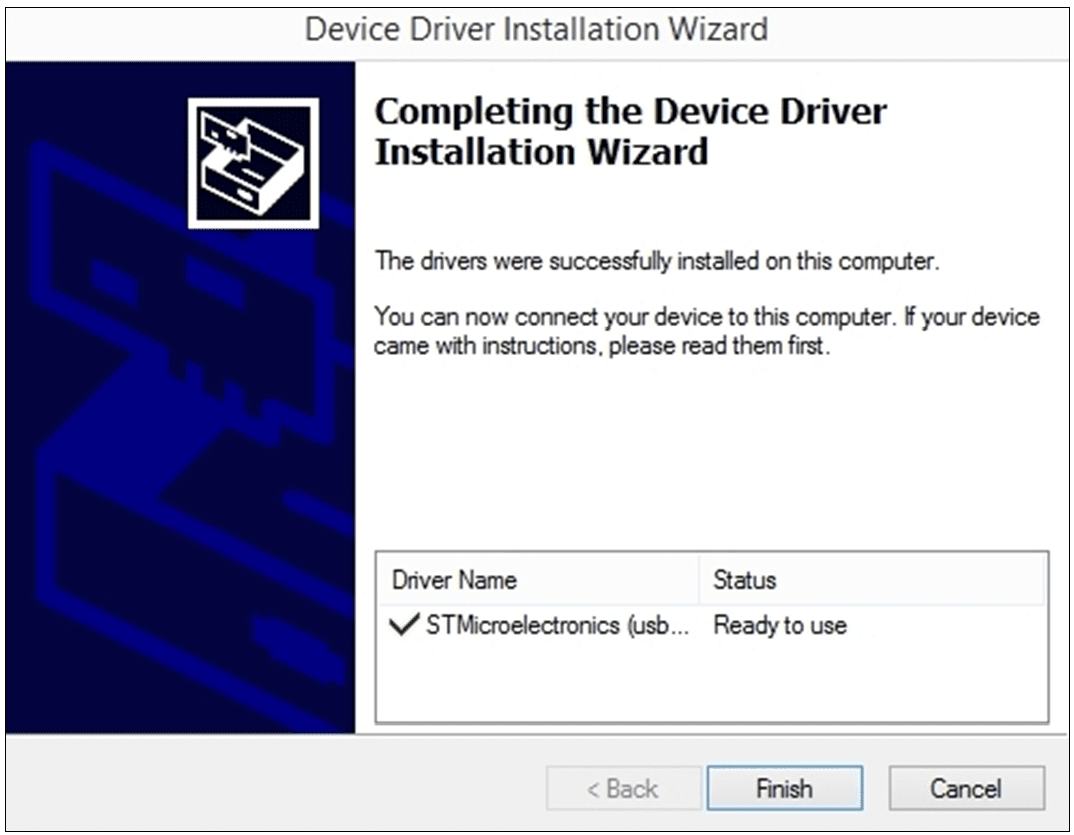
When the DataSnap is properly installed on a computer USB port, it will implement a generic COM port on that computer. This COM port should be visible in Device Manager as ‘Acclima Virtual COM port’. The communications settings for this COM port are unimportant, and can be ignored, since the output of the DataSnap is fixed as the SDI-12 protocol. This means that the DataSnap will operate regardless of the BAUD rate, stop bits, parity, or Flow control settings. Interfacing with the DataSnap requires software that can open and send/receive data over a COM port.
The DataSnap transfers SDI-12 commands from the USB port to the SDI-12 port without modification to the command string. However, any required Break signals, address mark, or other timing specific requirements are handled by the DataSnap. This removes the burden of SDI-12 timing from the computer, and simplifies the programming requirements for computer software, while providing a modern USB interface. Due to this architecture, all SDI-12 commands and capabilities are present when using the DataSnap, provided that the software using it is not limited. The SnapView software provided with the DataSnap can communicate with all types of SDI-12 sensors and is not limited to Acclima sensors.
Contact sales@acclima.com with questions.
Acclima, Inc.
1763 West Marcon Lane, Ste. 175
Meridian, ID 83642 USA
www.acclima.com