Installation and Best Practices
General Principles
Sensors should be installed horizontally in the root zone. Doing so minimizes variables that can arise when sensor waveguides (rods) are exposed to media at different depths and therefore different levels of water content.
When selecting a location for sensor installation, carefully consider the plants and where they will be planted. Make every effort to duplicate the conditions where the plants will be grown, so that the results can be replicated in the field as they are in the laboratory.
Block Hydration
Before inserting the sensor waveguide into the block, the block should be thoroughly hydrated.
Rock wool blocks are often inhomogeneous in density. Some portions of the block are more tightly packed than other portions. The denser volumes tend to be more hydrophobic and are difficult to wet. The less dense volumes tend to provide preferential paths for water to flow downward through the block creating wetter and drier regions throughout the material.
If the blocks are not thoroughly hydrated there will be air inclusions in the block that may remain dry for weeks – thus limiting root growth and creating false VWC and PWEC readings.
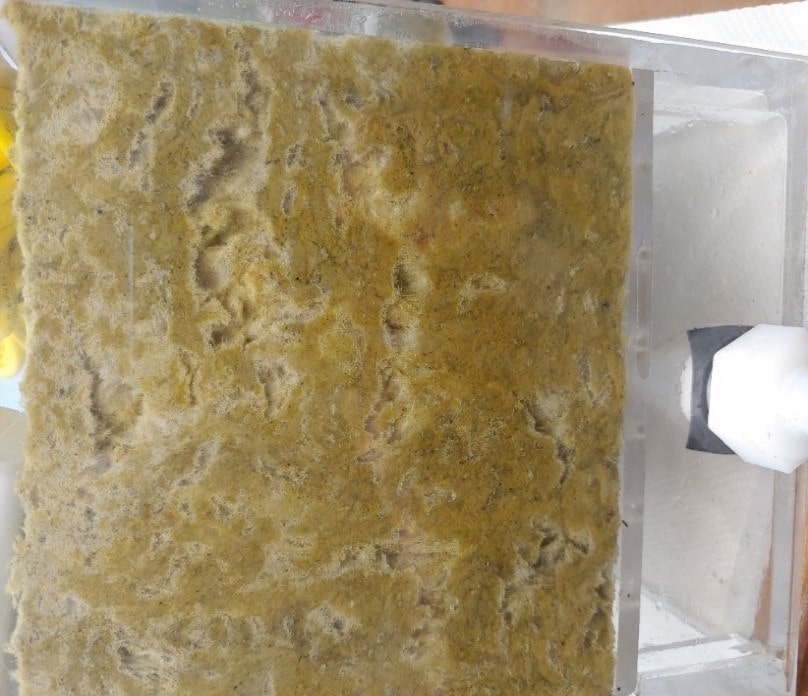 Figure 1. Rock Wool block showing the non-homogenous packing of the material.
A recommended method of hydrating a Rock Wool block is to place it in a bucket containing about 12 inches (300 mm) of water. The block will float for about a minute then sink below the surface when it is fully hydrated. Allow another minute or so for all bubbling from the block to stop. Then lift the block out of the water by the bottom to avoid tearing the fibers at the top of the block.
Vertical Positioning of Sensor
Rock Wool and other greenhouse substrates are generally used at high water content levels – at or above the field capacity of the material. This causes the water to ‘sink’ toward the bottom of the material as shown in Figure 2 below. Figure 3 shows measurements taken in a rock wool block that contained 46% water by volume. Measurements taken 1 inch from the top of the block reported 20% water content. Measurements taken 4” from the top of the block showed 63% water content. For blocks with less water content the position of the average water content shifts to some extent, making it difficult to get high accuracy readings. What this infers is, the level at which the sensor waveguide is inserted into the block is critical if consistent and reasonably accurate measurements are needed.
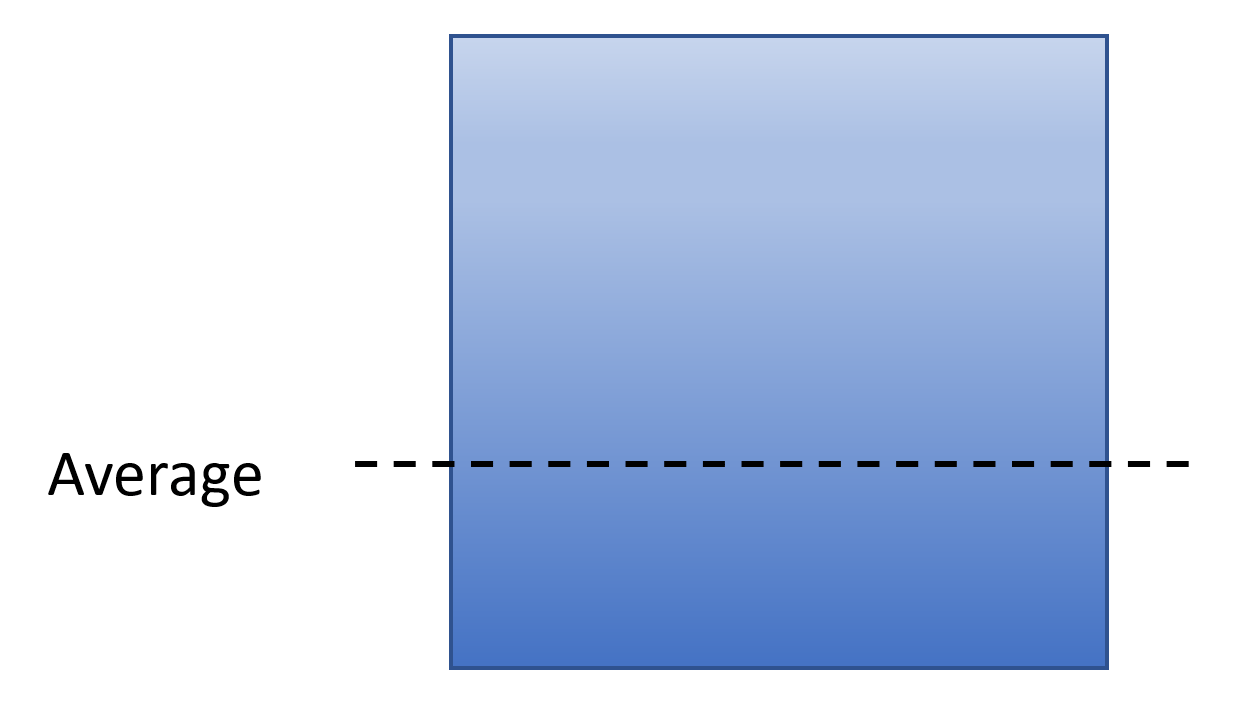
Figure 2. Distribution of water in a 140mm rock wool cube.
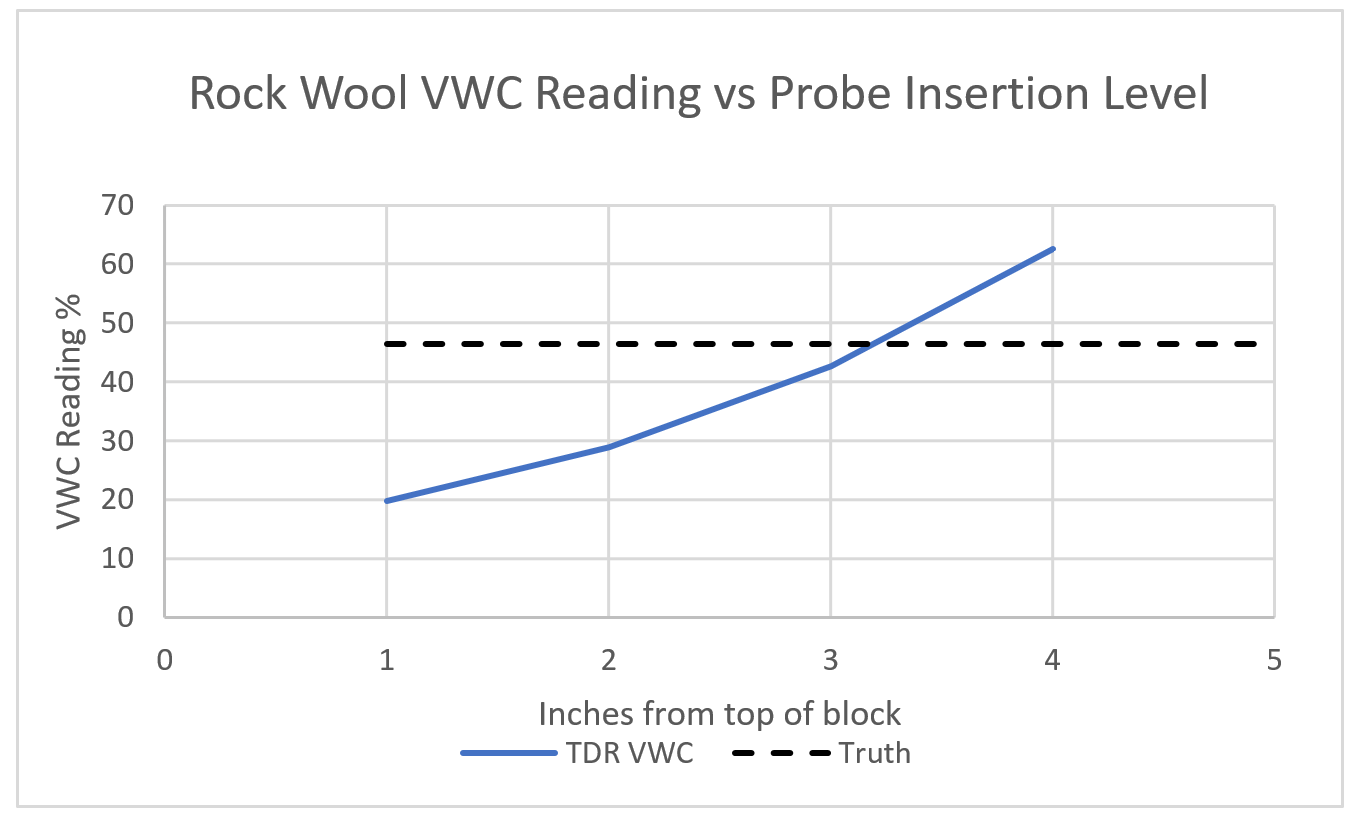
Figure 3. Vertical position of sensor vs. VWC reading in a 140 mm cubic Rock Wool block.
Waveguide Insertion
The waveguide should be carefully inserted into the pre-wetted rock wool block in a plane that is normal to the pull of gravity – in other words – level. 1.5 inches is the best depth for rock wool. If it is not level, then the influence of wetter regions below or drier regions above will influence the overall sensor reading and cause inconsistencies in controlling the water content in accordance with your chosen thresholds.
Often the tray that holds the block in production has sides that prevent access to the lower sides of the block. If this is the case the block will have to be removed from the tray and supported on an open level table while inserting the waveguide.
While inserting the waveguide into the block use a uniform straight inward force. Do not rock the sensor body back and forth. This creates voids around the waveguide and causes errors in the reported data. Make sure that the entire waveguide is inserted into the block.
Organic Substrates and Use with Growing Bags
Organic growing media is usually procured as loose material in bags or as dried and compressed bricks. When used in greenhouse applications it is normally placed into plastic bags to hold it together. The loose material needs to be compacted into the growing bag, otherwise it will not support the sensor well and air voids around the waveguide could occur and cause erroneous readings.
Hydration
The organic material, whether loose or in brick form, should be placed into a ‘plastic grow bag’. A typical bag has a volume of a little over 1 gallon and has small holes in its bottom. The bottom fold is also not sealed and will allow water to leak in and out. Place the media into the grow bag, then place the bag into a bucket containing about 8 – 10 inches of water or nutrient solution and allow it to sink to the bottom. The top of the grow bag should be secured firmly in place to keep it from capsizing into the water. Allow the bag to sit in the water until the top surface of the media is fully hydrated. This may take an hour or so, longer if the bag contains a dehydrated, compressed brick. Compact the wet material into the bag so that it is dense enough to support the sensor waveguide.
Vertical Position
Coco and peat-based materials have a higher field capacity than rock wool and do not exhibit as much of a water gradient. But a mild gradient will form at saturation levels in the organic material. Hence it is needful to be consistent with the level of insertion into the bag wall. The Waveguide Insertion Tool can be used to provide this consistency and to provide a flat void-free penetration into the soil. A common level for waveguide insertion is about 1.5 inches from the bottom of the substrate.
Sensor Waveguide Insertion
Place the bag on a flat table or greenhouse tray and press the soil downward to ensure that the bottom is flat. Often it is difficult to force the sensor waveguide through the plastic bag sidewall. Be careful not to break up the soil. Push straight in to avoid creating air channels along the sensor waveguide rods. It may be necessary to re-compact the material after the waveguide has been inserted.
Mineral Soils
The TDR-310W was designed for greenhouse applications, but it can also be used in field applications as well. It is inherently accurate in all mineral soil types without soil-specific calibration.
Installation
When working with mineral soils, the recommended method of installation is to dig a vertical-walled trench with one dimension at least 12 inches (305 mm). The depth of the trench should be a couple of inches below the depth at which the sensor is to be installed. Insert the waveguide rods horizontally into the vertical wall at the end of the trench. Use the Waveguide Rod Spacing Tool to prevent the rods from splaying out during the insertion. This tool is placed over the waveguide rods and up against the soil wall before pushing the waveguide into the soil. It provides the proper spacing for the rods so that they are inserted in a parallel alignment. After the waveguide is about half-inserted the spacing tool can be removed.
The insertion force may be quite severe in some soils. This can be reduced by thoroughly watering the soil before installation and/or by using a mechanical force multiplier to push the sensor into the sidewall. Acclima sensors are built to survive harsh environments however, it is still important to refrain from damaging the waveguides during insertion. Especially in places where there may be impenetrable objects.
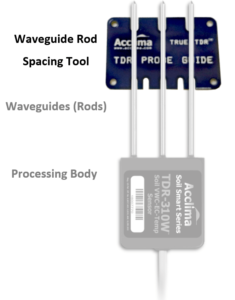
Figure 6
Reported Data Items Using the aD0! Command
Readings are initiated using the SDI12 aM! Command or the aM1! Command. The sensor responds to theses commands with its address, the number of data items to be returned and the time required to acquire the data. The data recorder waits the specified time or waits for a service request from the sensor – whichever occurs first and then sends the aD0! Command. Upon receiving the aD0! Command the sensor immediately returns 5 data items in the order listed below:
- Volumetric Water Content (VWC)
- Temperature (T)
- Permittivity (εa)
- Bulk Electrical Conductivity (BEC)
- Pore Water EC (PWEC)
SDI-12 Connector
The sensor is hardware compatible with the standard SDI-12 communications system and will work with any SDI-12 controller or data recorder compliant to version 1.4. For use with Acclima readers and recorders a connector is available into which the cable wires are inserted and screwed down. The connector then plugs into the recorder or reader. Figure 7 depicts the end of the TDR-310W cable with its stripped and tinned conductors.
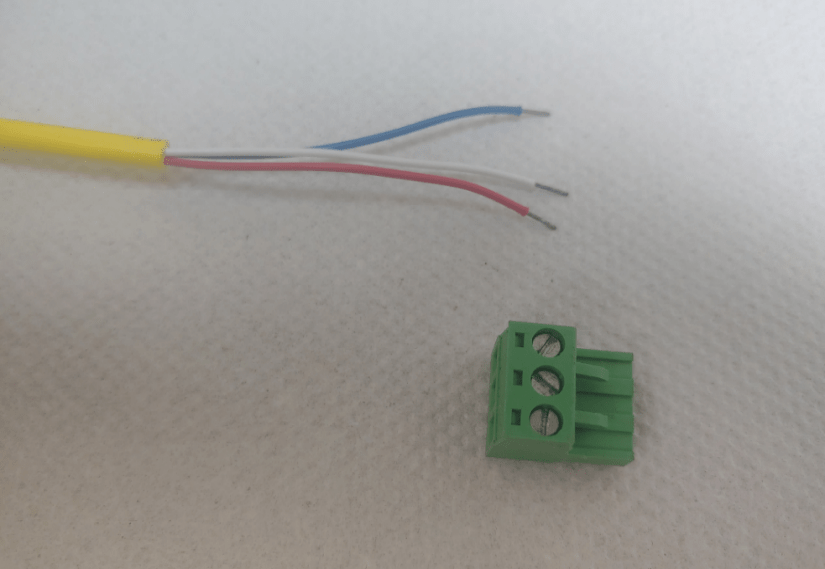
Figure 7. Red wire (SDI-12 power), white wire (SDI-12 common), and blue wire (SDI-12 data connection).
Understanding the Science
Theory
Measuring a soil’s permittivity is an excellent way to derive a soil’s water content because the permittivity of water far exceeds the permittivity of the other components of a soil’s composition. Highly accurate VWC readings can therefore be derived from highly accurate permittivity measurements.
Permittivity is an important physical property underpinning the operation of the universe. It manifests itself in fundamental electromagnetic behavior; in the unique properties of water molecules, in the propagation of light and just about everything that makes the universe possible. There are two separate and different natural phenomena that have been explored and identified by physicists that correlate to the natural phenomena of permittivity. One of these is the relationship of an electric field to an electron charge – known as Gauss’ Law. Capacitive and Frequency Domain sensors are based in Gauss’ Law. The other is the speed of light which is governed by the permittivity of a medium through which an electromagnetic wave passes. Time Domain sensors like our Acclima TDR-310W are also based in this principal. These two manifestations of permittivity in nature have entirely different impacts on the accuracy and method of deriving water content. Sensors that are based in the first manifestation (Gauss’ Law) can be categorized together under the heading of Gaussian Sensors. Sensors that are based in Time Domain measurements can be classified as Time Domain sensors.
The advantage of Time Domain technology is found after learning that the speed of light in salt water is essentially the same as the speed of light in fresh water and permittivity readings taken in soils that are completely void of salts, and are uniquely very close to readings taken in salty soils of the same water content. Time Domain measurements are more accurate because they are independent from other electrical properties of the medium through which the EM waves pass – properties such as electrical conductivity and compaction.
Measuring Permittivity and Volumetric Water Content
Acclima’s TDR-310W technology launches a fast-rising electromagnetic impulse down the length of its 10 cm waveguide. The EM signal travels to the end of the waveguide and then reflects from the open end and returns to the source. The total round-trip time in air (which has a permittivity of 1.0) is 667 pico-seconds. In water at 20.7° C the permittivity is 80.0 and the round-trip time is 5,963 pico-seconds. In soils at various water contents the round-trip propagation time will be somewhere between 667 and 5,963 pico-seconds – depending precisely on the permittivity of the surrounding medium which is tightly tied to water content.
The challenge with TDR technology is measuring such short time intervals.
Acclima sensors measure propagation time with a resolution of 5 pico-seconds and an accuracy of 1%. 5 ps is the time required for light to travel 1.5 mm in air or 0.168 mm in water. The returning waveform contains the history of the round-trip, including the propagation time and all the scenery along the way. These details are digitized and recorded in a 4,000-point image at 5ps resolution. Highly specialized hardware and firmware are required to accomplish this seemingly impossible task. The ultra-high-speed silicon-germanium circuitry used for this purpose is not only expensive but also consumes considerable power. To keep energy consumption down the digitization control and subsequent signal processing are done with a high-speed microprocessor.
The propagation time is measured from the launch of the incident to the arrival of the reflected EM wave. From that the permittivity of the medium is calculated with the EM propagation equation ε = t2/(4µl2).
Electromagnetic Propagation
ε = t2/(4µl2)
Where t is the measured propagation time, ε is the medium permittivity, l is the waveguide length, and μ is the magnetic constant – another universal constant that does not vary for non-magnetic soils.
Permittivity is converted to Volumetric Water Content using a proprietary form of the Topp Equation.
Mineral soils are comprised of mineral substances that have permittivities ranging typically from 2 to 4. At dry conditions the permittivity of the water becomes overshadowed by the mineral permittivity. This competition is reasonably handled by the Topp equation and reasonable accuracies are reported in dry soils. Dry organic soils have a permittivity of 1 and are not handled well at the dry end of the mineral derived Topp equation. Due to this and other effects, a special calibration equation is used to correct the VWC readings taken in organic soils.
Bound Water Effects
Organic soils and mineral soils with fine textures have a high specific surface area. In other words, the total surface area of all the microscopic soil particles is orders of magnitude higher than in coarser-textured soils. Water molecules in these soils have a high likelihood of being near a soil particle. The attachment of the water molecules to the soil particle causes water molecules (bound water) to become sluggish in its response to an electromagnetic wave. Hence, the bound water molecules get ‘left out’ of the accounting of the total water sample.
Waveforms
Another powerful contribution of TDR technology is that the digitized waveform contains much more information than just the propagation time. Each different soil type has a waveform ‘signature’. Figure 8 below, shows two TDR waveforms from two different soil types having the same water content. The Norfolk sample is a silt soil type and shows a sharply defined reflected wave occurring at about 4500 pico-seconds. The Pullman sample is a clay soil showing a reflection occurring at about 4200 pico-seconds which would indicate a lower water content than the Norfolk sample. Notice the rise of the waveform beyond the reflection is sluggish – this indicates bound water. By analyzing the shape of the curve, the amount of bound water can be determined and added to the free water – thus obtaining the correct 21% water content. Acclima TDR sensors use this ‘Soil Smart’ technology to obtain accurate water content readings in any type of soil without the need for soil-specific calibrations. See U.S. Patent 10,102,473.
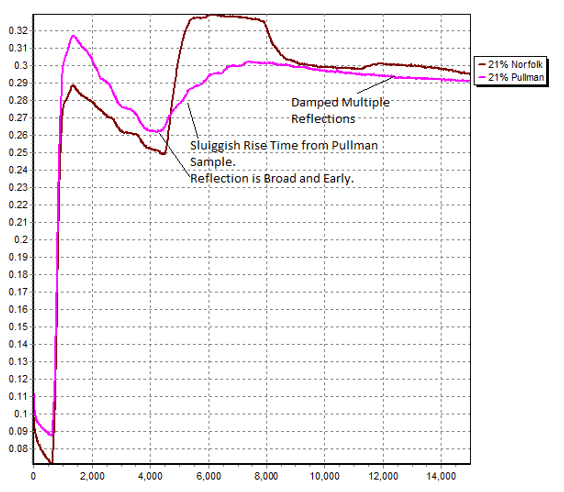
Figure 8. TDR Waveform ‘Soil Signatures’ from two different soil types with the same water content.
Reading Modes and Repeatability
Under normal growing conditions where a sensor is exposed to nominal Bulk Electrical Conductivity levels. The digitized waveform captured by TDR-310W shows a strong and highly repeatable reflected wave. At extreme nutrient levels where burning to plants can occur, the reflected wave becomes attenuated due to an electrical shorting effect from the conductive soil. The time position of the reflected wave becomes more difficult to measure accurately and the resultant VWC readings may vary and show a jagged response on the data charts. The jagged response can be eliminated by gathering several waveforms and performing a statistical analysis among them. This makes the reported data very repeatable but at the expense of processing time.
Normal Mode
The Normal Mode of data gathering uses the aM! command and returns the data points in less than a second. Therefore, when operating from a 7-volt power supply, the sensor consumes about .35 Joules of energy. By comparison a 3 Ah Lithium Iron Phosphate battery stores about 35,000 Joules.
High Repeatability Mode
The High Repeatability Mode uses the aM1! command. This causes the sensor to gather and process 5 waveforms and perform a statistical analysis to come up with a highly repeatable VWC number. This mode is recommended when BEC levels are expected to be at 3000 uS/cm and above. The downside to using this mode is that the total reading time is about 1.3 seconds. That means that the energy consumption is 1.37 Joules or about 4 times the energy consumption of the Normal Mode.
Measuring Bulk EC and Pore Water EC
Bulk Electrical Conductivity
Bulk Electrical Conductivity (BEC) is calculated by measuring the attenuation in the TDR waveform after a long period of time – a whopping 200 ns! As the wave propagates through the soil, the salts in the soil dissipate a portion of the EM Waves’s energy – depending upon the bulk electrical conductivity of the soil. The calculated BEC is the average conductivity of the soil along the length of the waveguide.
Pore Water Electrical Conductivity
Pore Water Electrical Conductivity (PWEC) is calculated from BEC and the permittivity of the medium using the Hilhorst Equation.
PWEC = εpσb/(εb-εσb=0)
Where, εp is the permittivity of the wetting solution (water) and is equal to 80 at 20.7 °C, σb is the BEC reported by the sensor εb is the bulk permittivity reported by the sensor, and εσb=0 is the permittivity of the soil when it dries to the point that BEC=0.
The term εp can be corrected for temperature using the equation εp = 80.3 – 0.37(T-20). Where T is the soil temperature in degrees °C reported by the sensor.
The key to accuracy and reasonable behavior of the Hilhorst model lies with the term εσb=0. The Hilhorst model is an approximation and yields extreme errors at low VWC levels – unless adjustments to this term are made. Acclima has developed an empirical model that properly scales εσb=0 to an optimum value as the soil dries out. By using a variable for this term instead of a constant, Acclima sensors report reasonably accurate PWEC values across the full range of VWC including the dry range.
Performance Graphs
Organic Soils – VWC Readings:
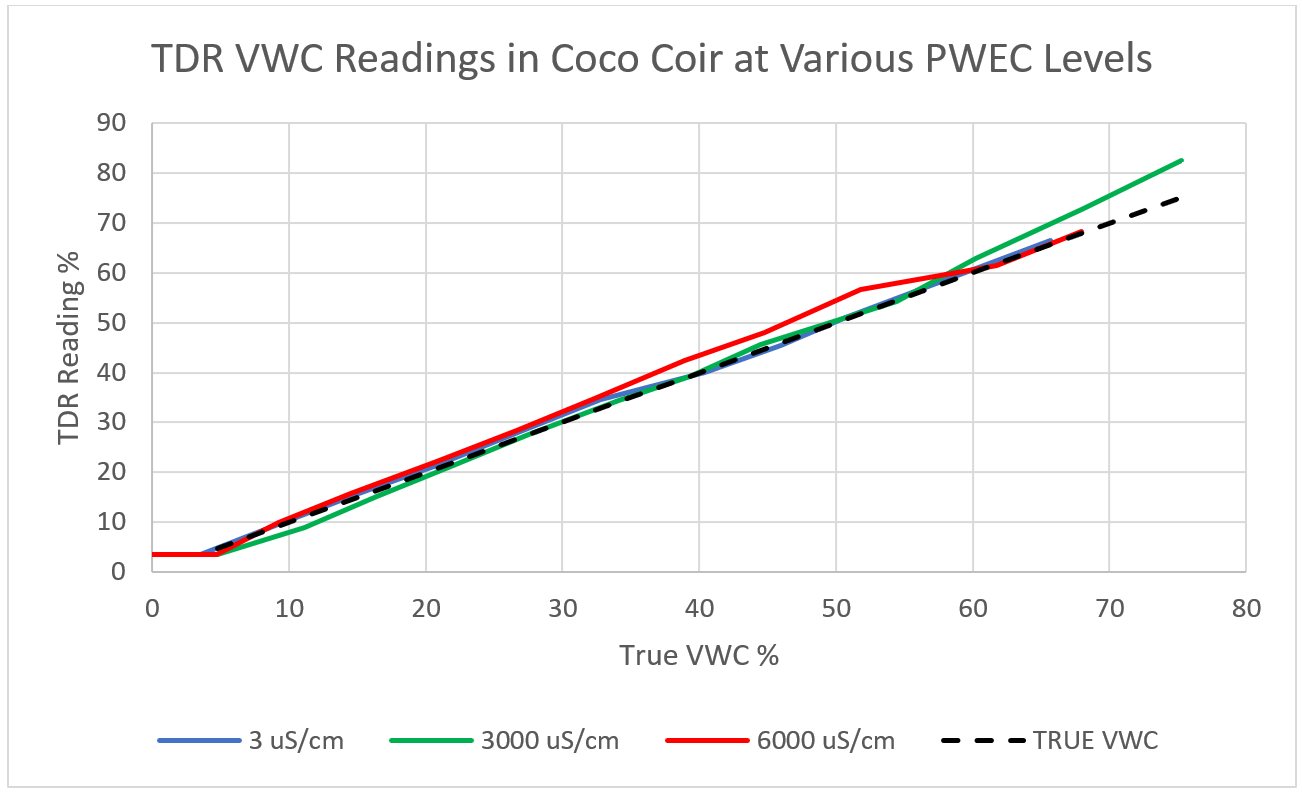
Figure 9. TDR sensor readings in Coco Coir wetted with distilled water and with 3,000 uS/cm and 6,000 uS/cm salt water. An organic soil calibration was used for these readings.
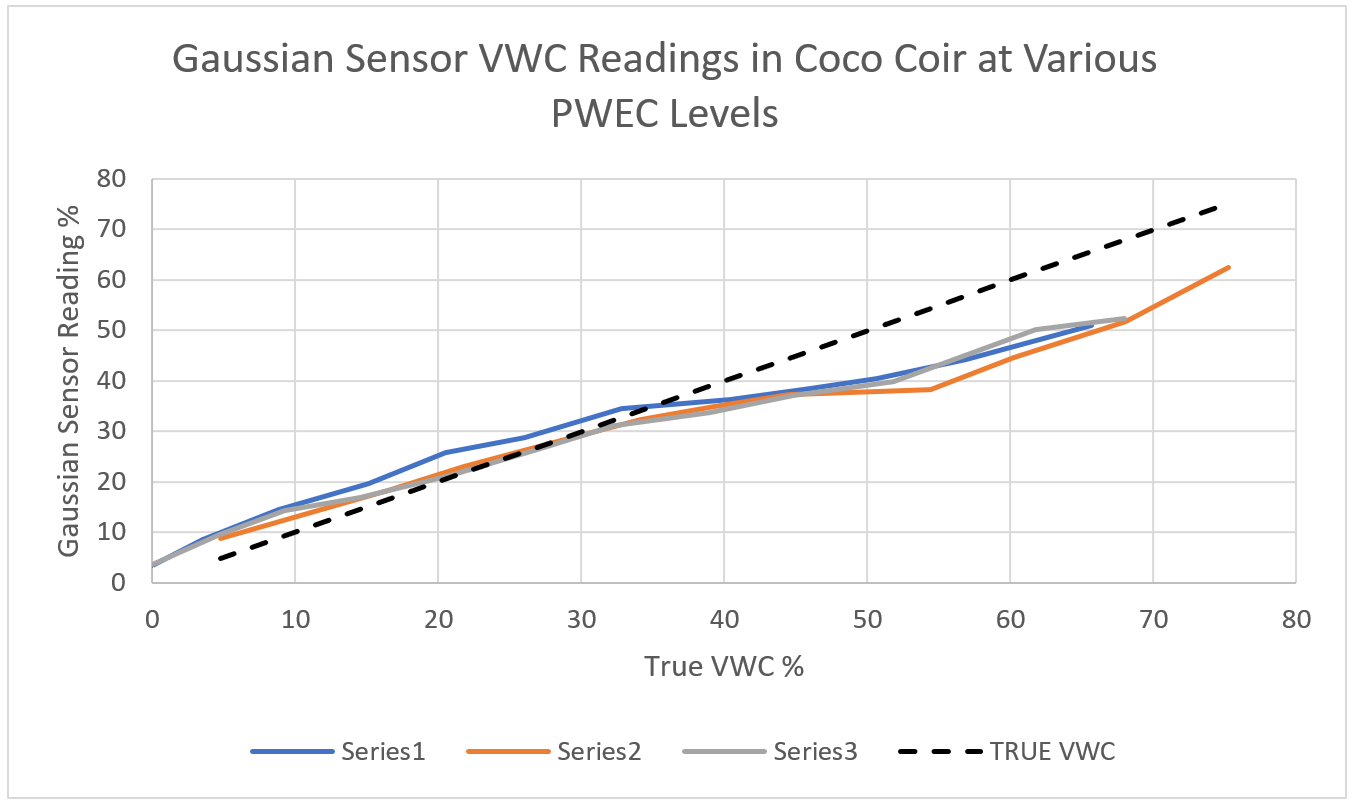
Figure 10. Gaussian sensor VWC readings in Coco Coir wetted with distilled water, 3,000 uS/cm salt water and 6,000 uS/cm salt water. The ‘soilless’ calibration was used in gathering these data.
Organic Soils – PWEC Readings:
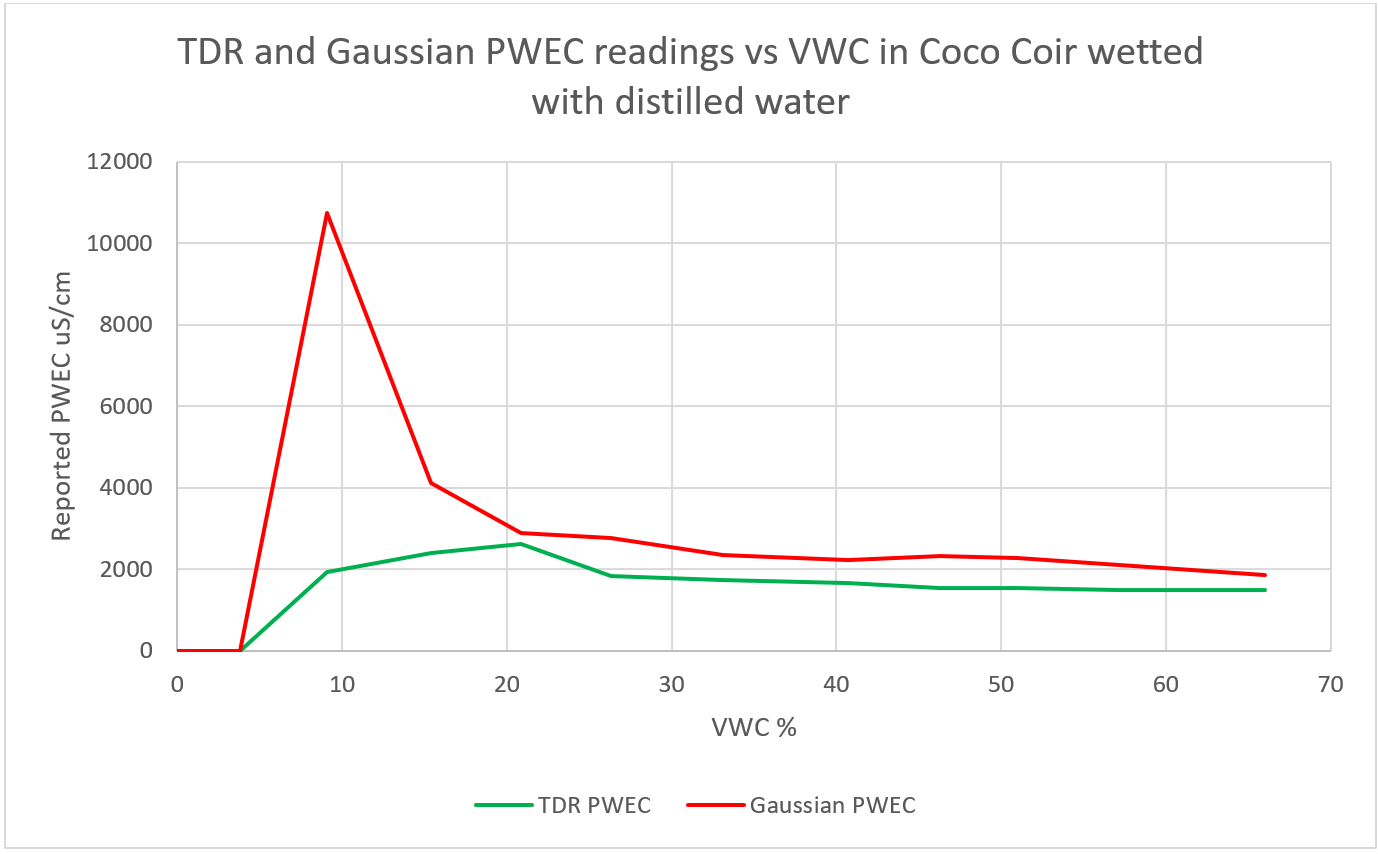
Figure 11. Comparative PWEC readings from the TDR and Gaussian sensors in Coco Coir wetted with distilled water. The residual salt in the dry Coco Coir is responsible for the non-zero PWEC measurement. As more water is added the PWEC reading drops because of the dilution of the residual salts.
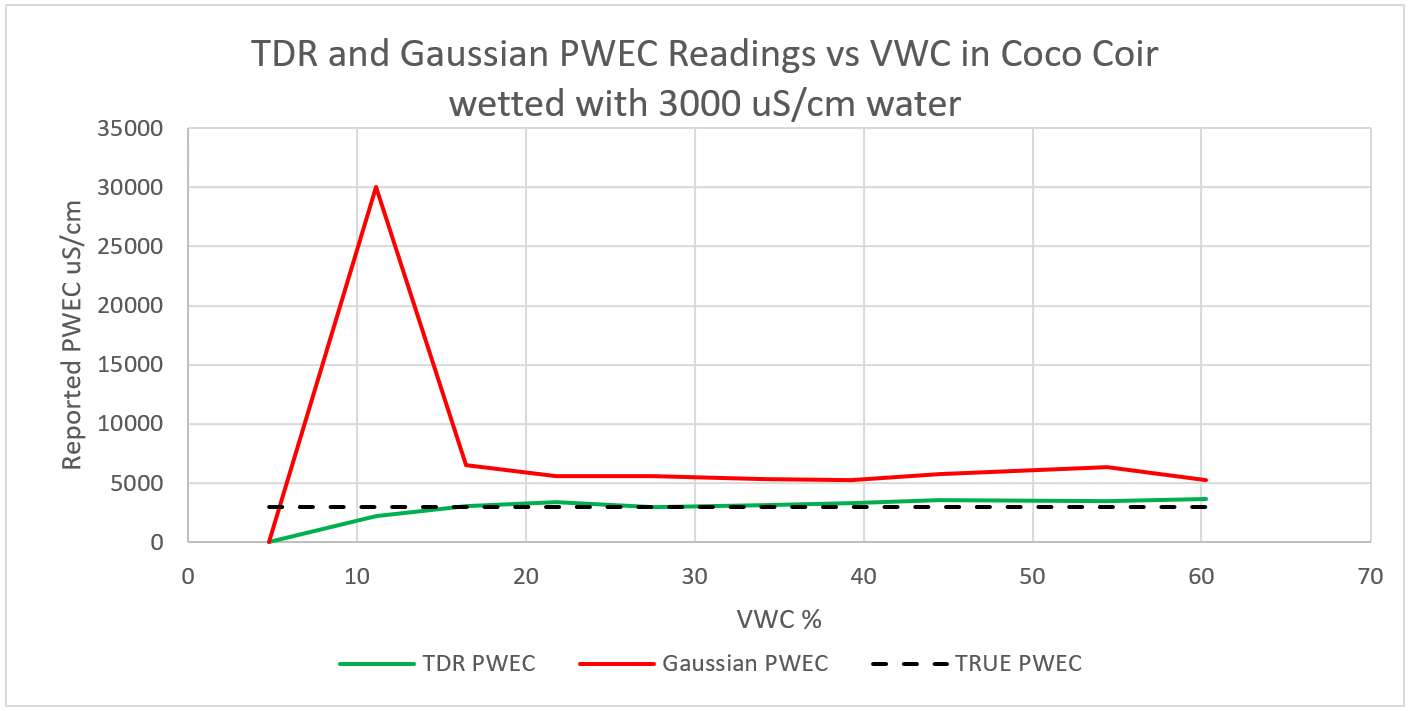
Figure 12. TDR and Gaussian PWEC responses in Coco Coir wetted with 3,000 uS/cm water. The TDR sensor shows good accuracy from 15% to 60% VWC and behaves well in the dry soil area.
PWEC Reading:
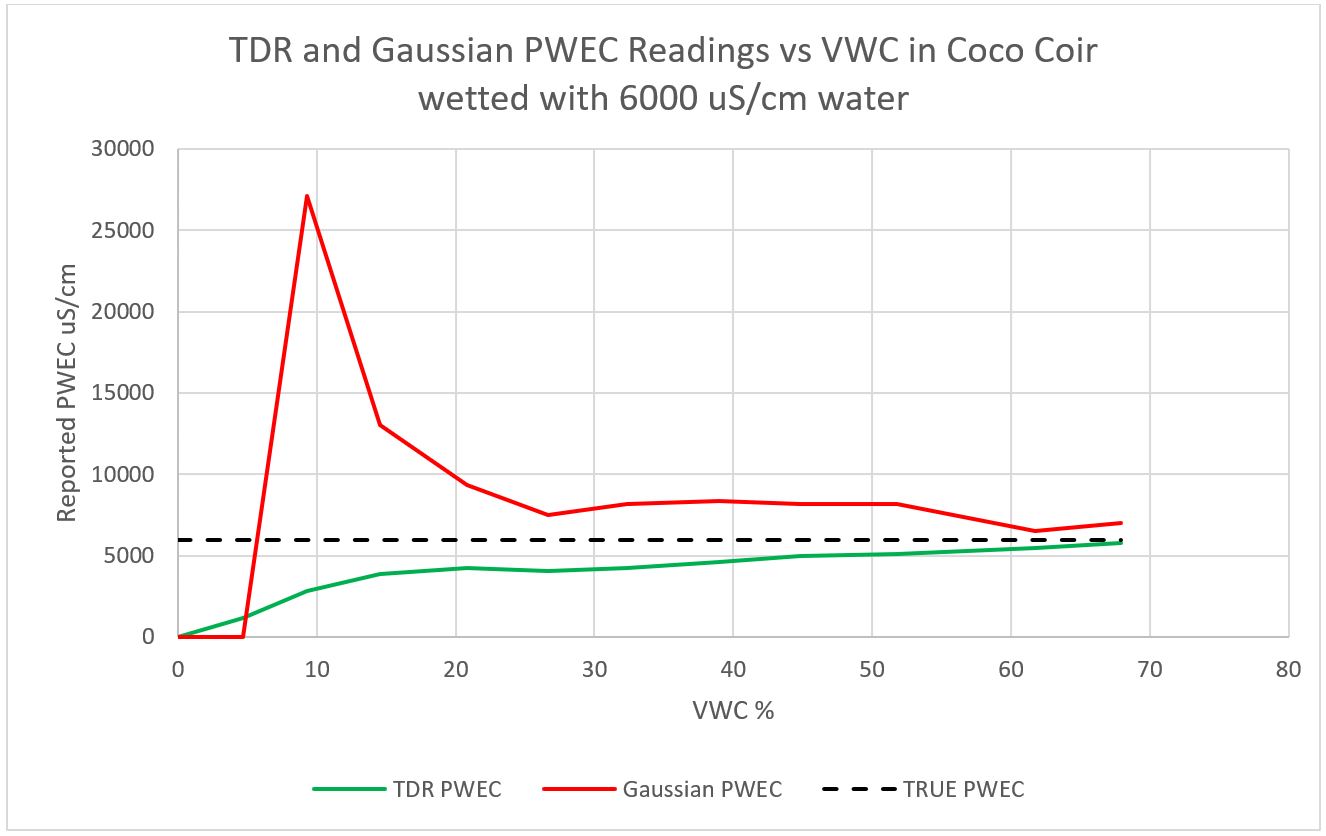
Figure 13. TDR and Gaussian sensor PWEC readings in Coco Coir wetted with 6,000 uS/cm water.
Rock Wool – VWC Readings:
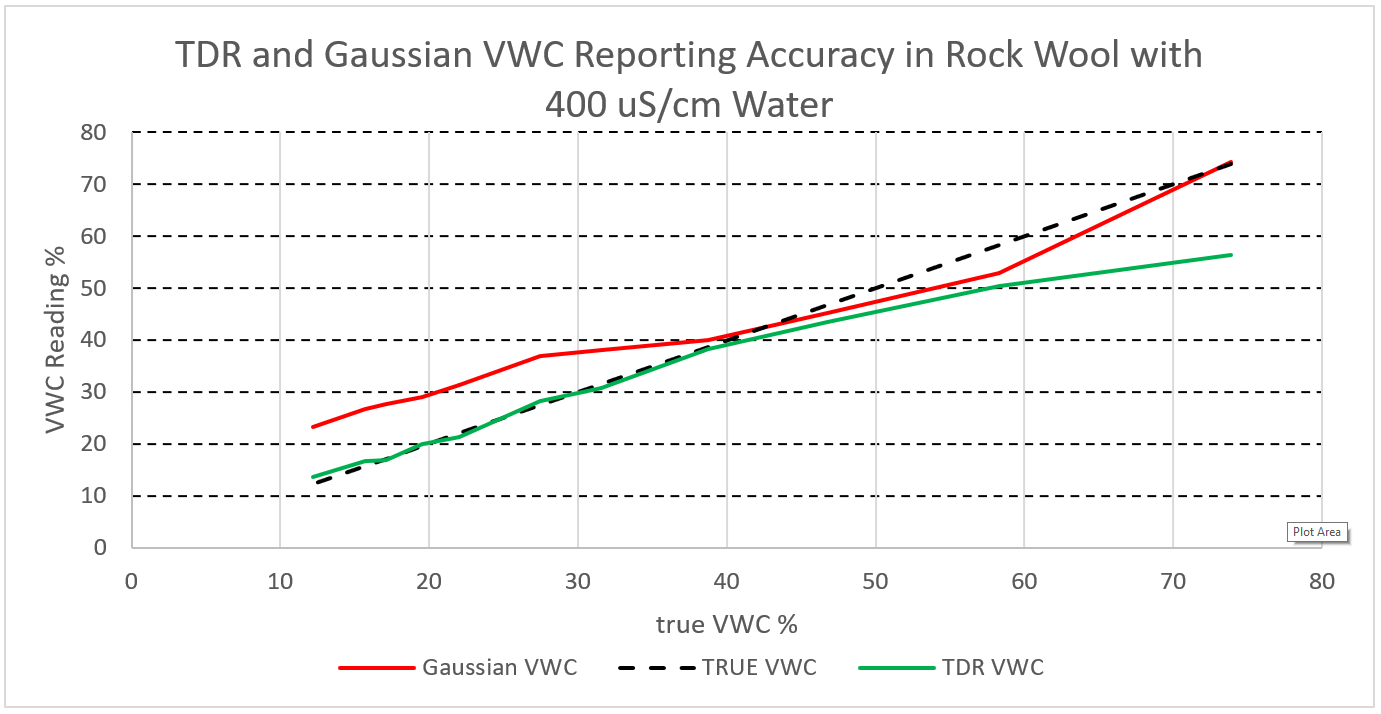
Figure 14. TDR and Gaussian sensor VWC readings in rock wool wetted with distilled water. The TDR sensor uses a Rock Wool calibration. Both probes were inserted at 1.5 inches from the bottom of the block.
Rock Wool VWC:
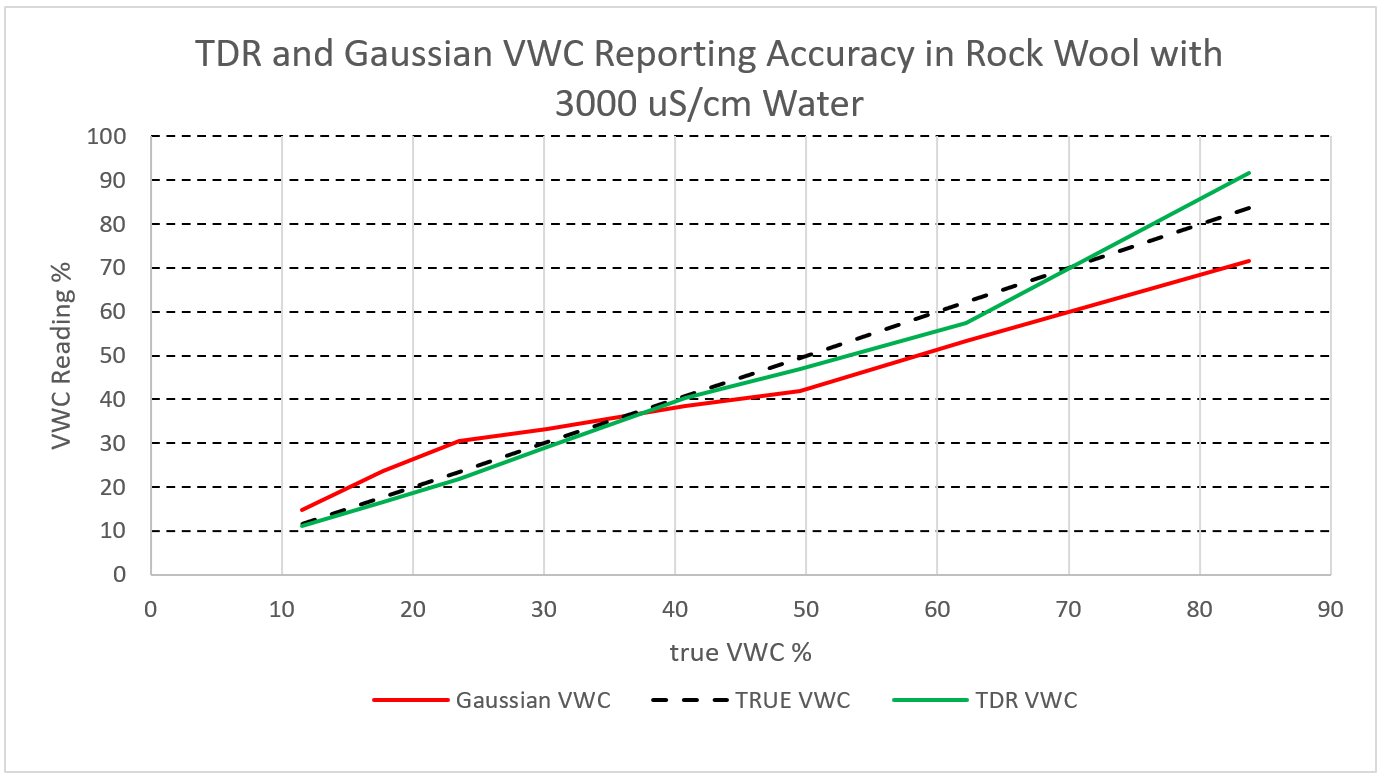 Figure 15. TDR and Gaussian sensor VWC readings in rock wool wetted with 3,000 uS/cm salt water.
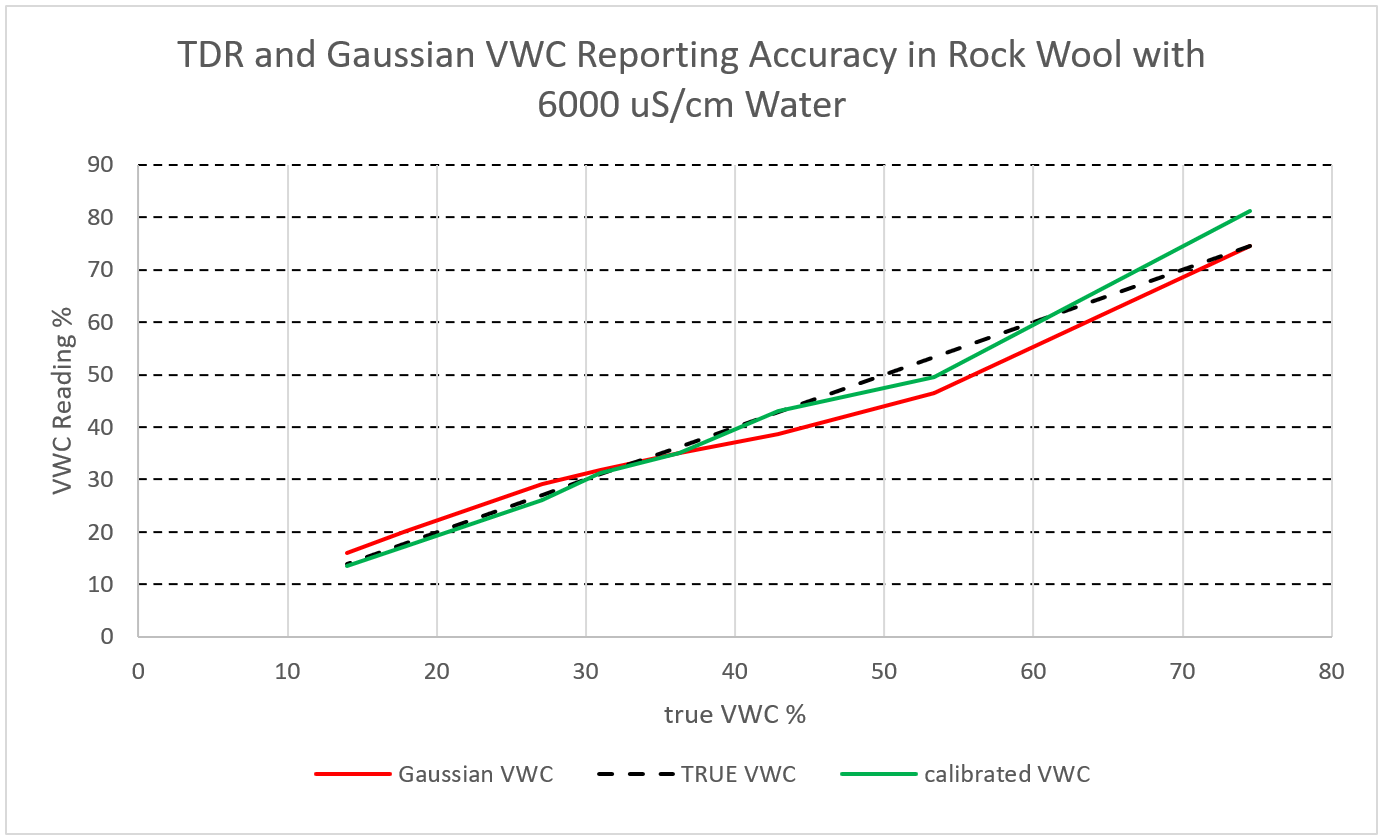
Figure 16. TDR and Gaussian sensor VWC readings in rock wool wetted with 6,000 uS/cm salt water.
Rock Wool VWC:
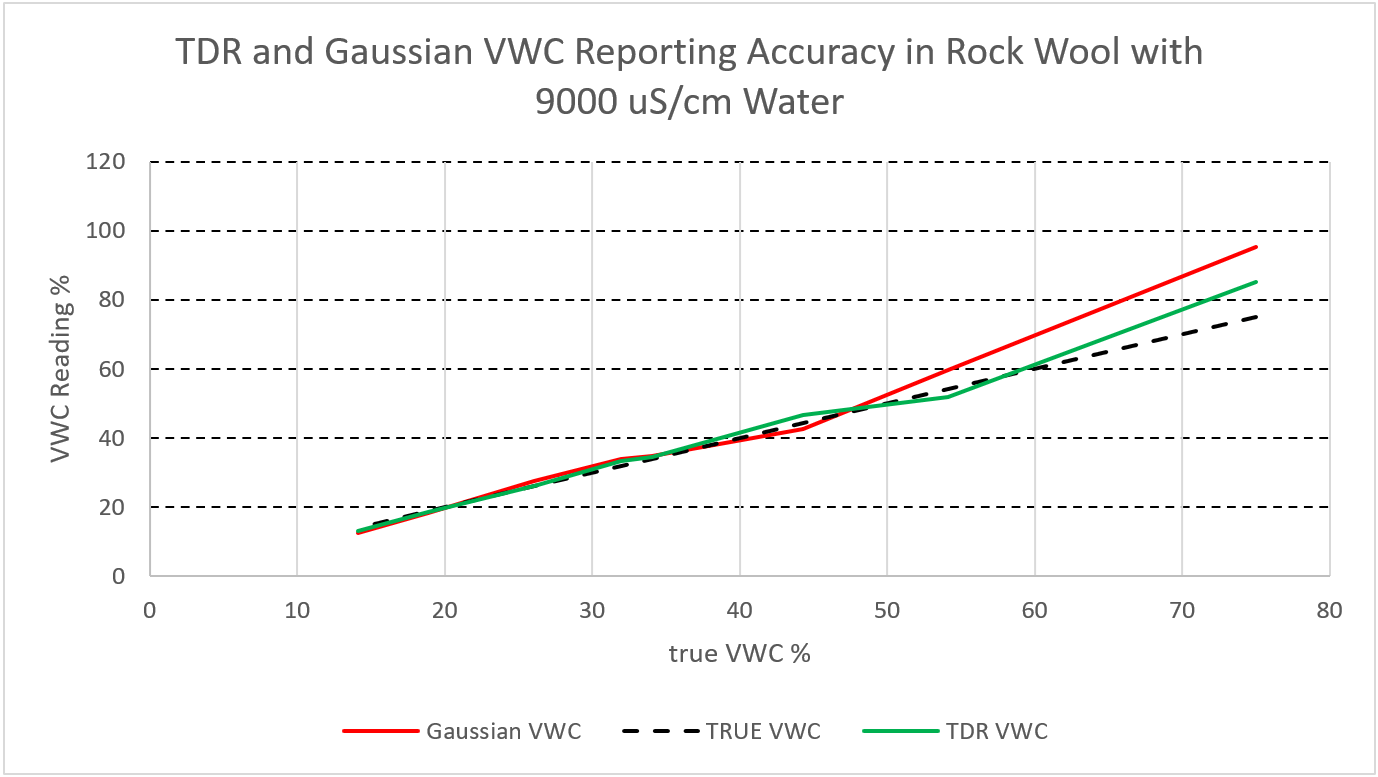
Figure 17. TDR and Gaussian sensor readings in rock wool wetted with 9,000 uS/cm salt water.
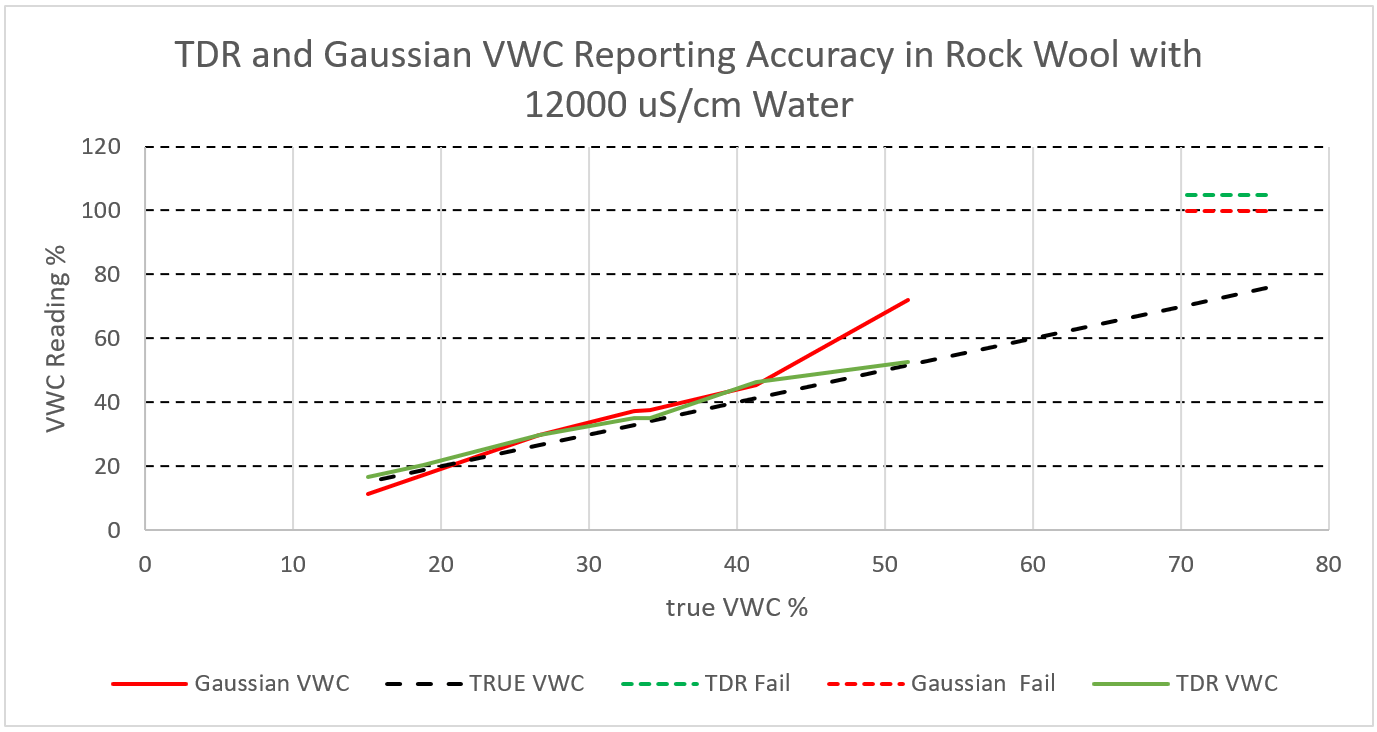
Figure 18. TDR and Gaussian sensor readings in rock wool wetted with 12,000 uS/cm salt water. Both sensors failed above 60% VWC. The Gaussian sensor reported 100% as its failed value. The TDR sensor reported 105% as its failed value.
Rock Wool – PWEC Readings:
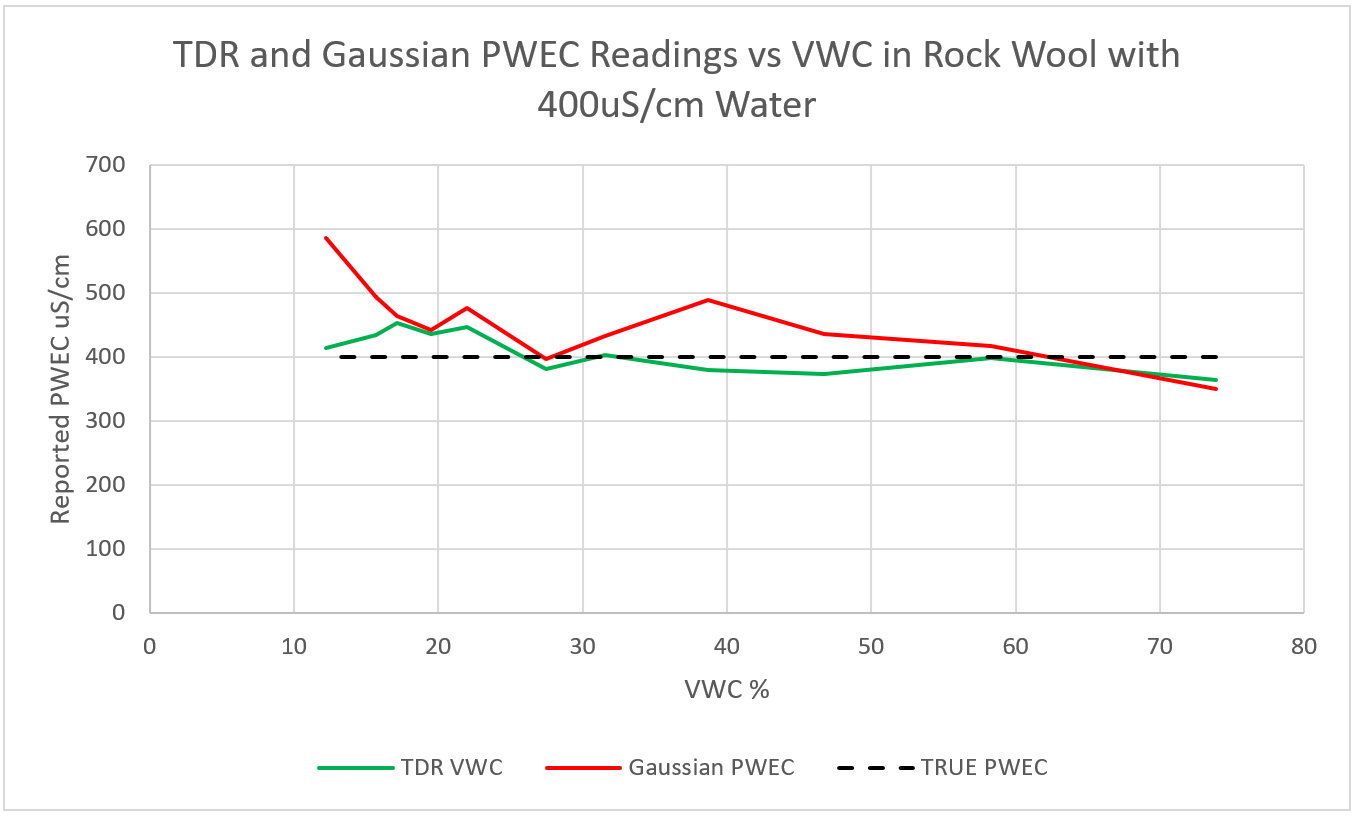
Figure 19. TDR and Gaussian sensor PWEC readings in rock wool wetted with distilled water.
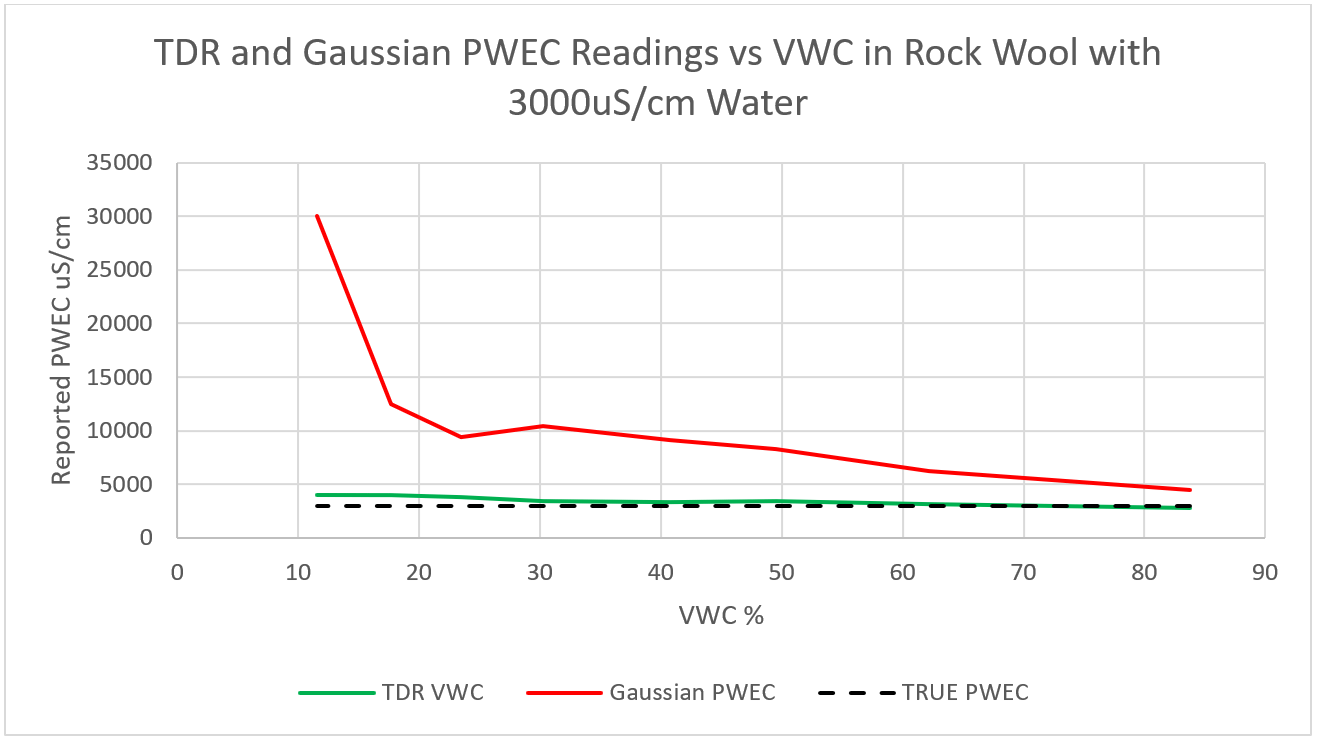
Figure 20. TDR and Gaussian sensor PWEC readings in rock wool wetted with 3,000 uS/cm salt water.
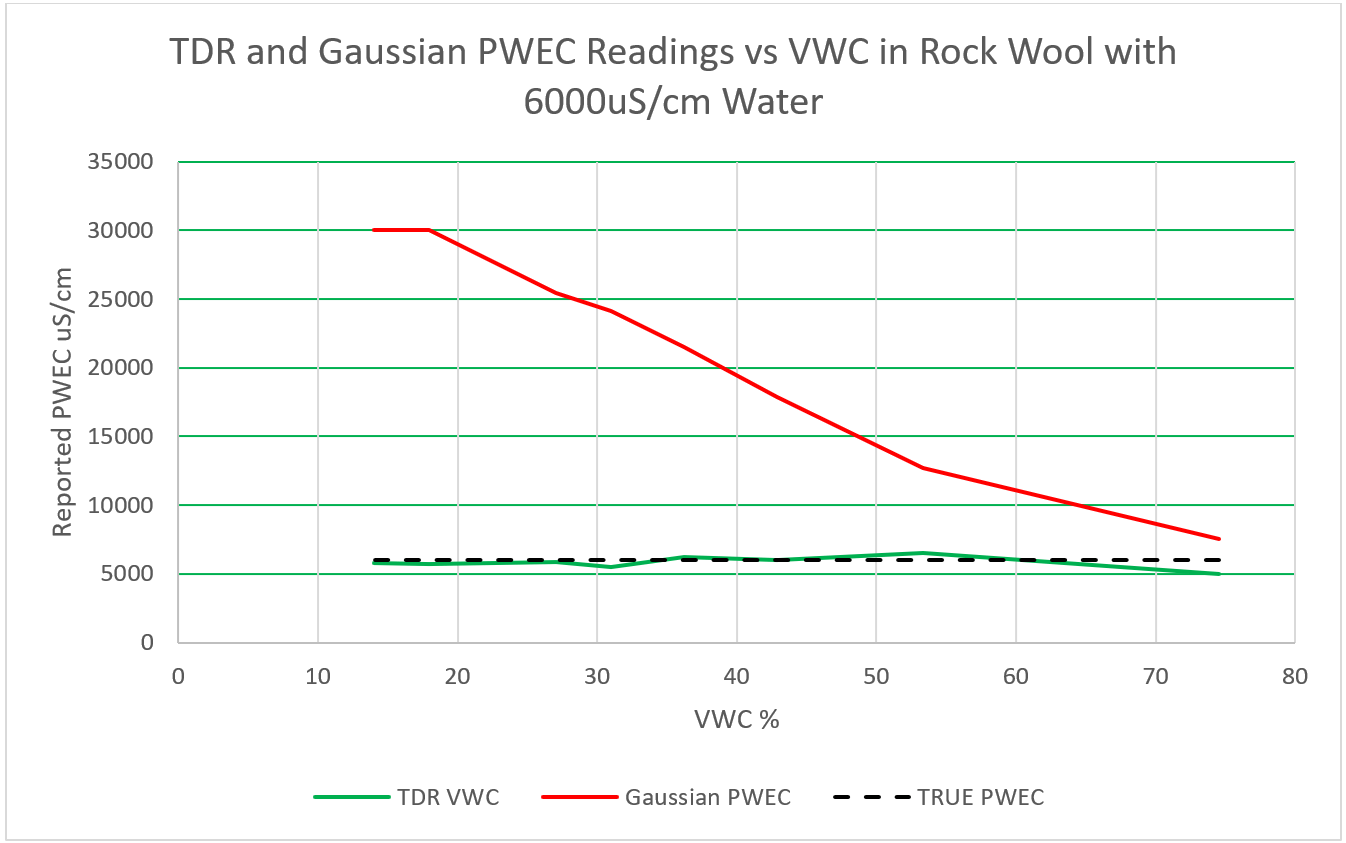
Figure 21. TDR and Gaussian sensor Pore Water EC readings in rock wool wetted with 6,000 uS/cm salt water.
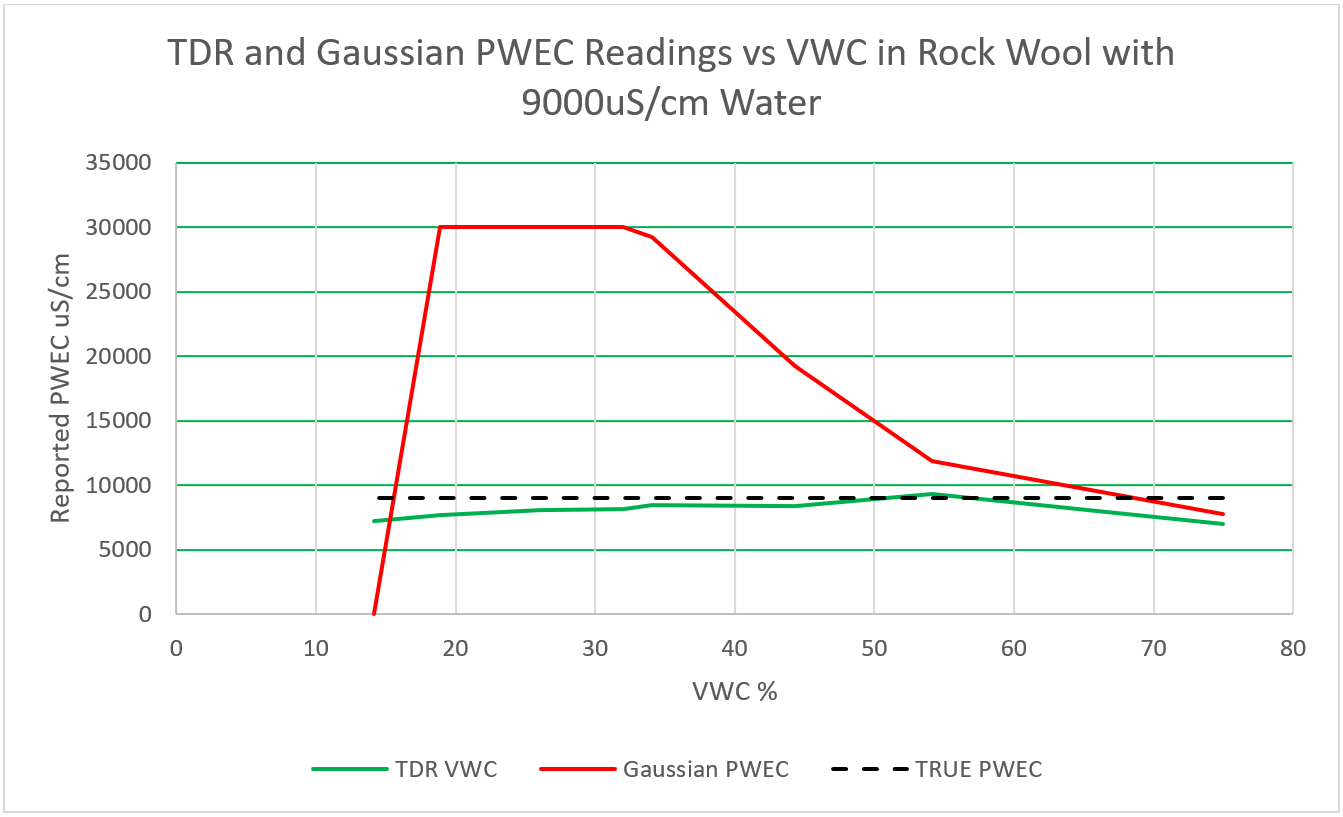
Figure 22. TDR and Gaussian sensor Pore Water EC readings in rock wool wetted with 9,000 uS/cm salt water.
Rock Wool PWEC:
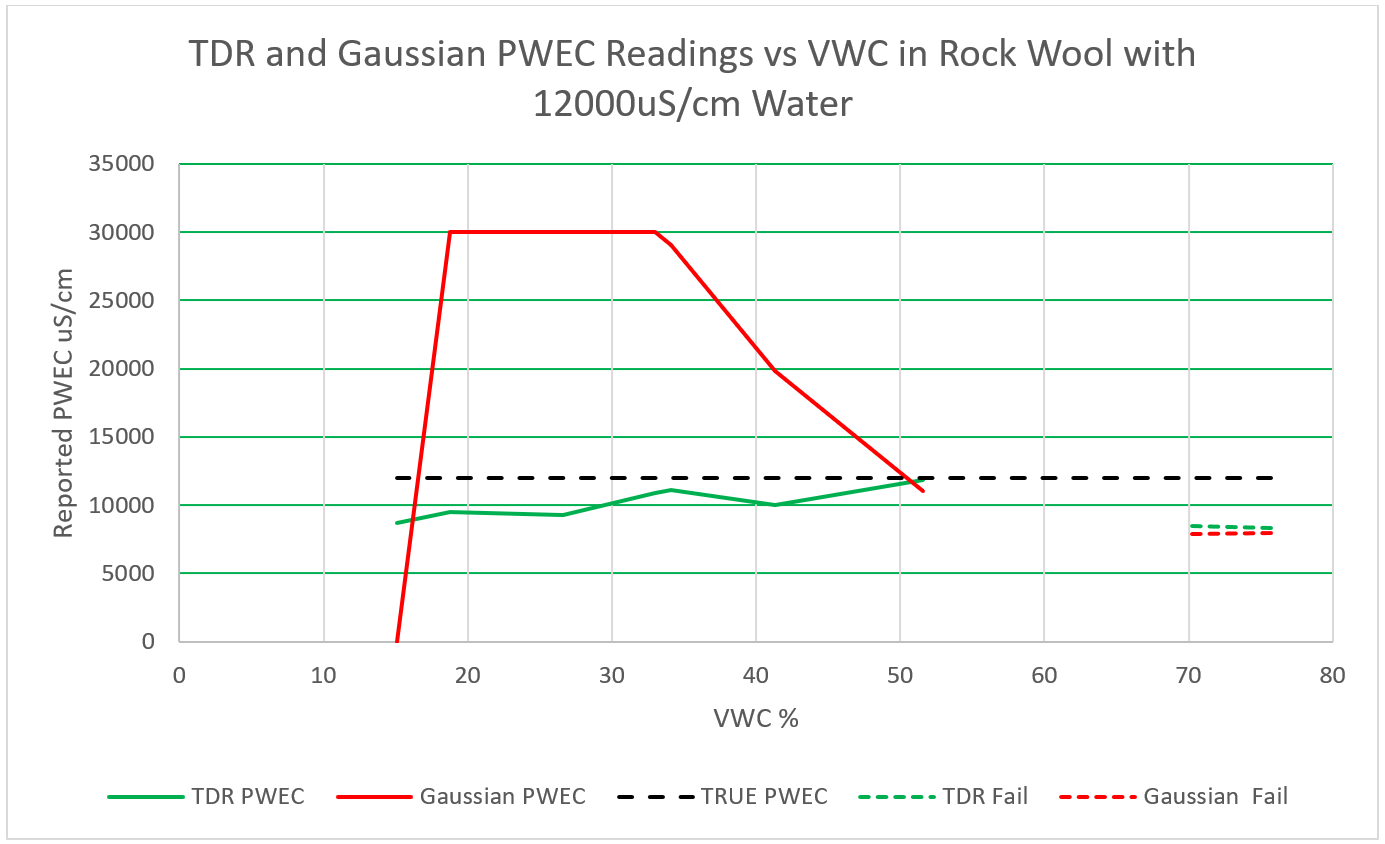
Figure 23. TDR and Gaussian sensor Pore Water EC readings in rock wool wetted with 12,000 uS/cm salt water. Both sensors failed above 60% VWC. The Gaussian sensor reported 7,500 uS/cm for the failed value. The TDR sensor reported 8,000 uS/cm for the failed value.
Sensor Calibration
The TDR310W does not require soil specific calibration for mineral soils. Its native readings are quite accurate for all soils in which the comprising mineral has a relative permittivity of 2 to 4, regardless of the soil type.
Organic Soils
Organic soils which have a dry permittivity of 1 can be accurately measured using the calibration equation,
VWC = 0.0002 * (VWCn)3 – 0.0087 * (VWCn)2 + 1.3 * VWCn + 3.5
Where VWC is the calibrated Volumetric Water Content expressed as a percent and VWCn is the native VWC percent reading from the sensor. The graphs shown in figures 11-13 were made using this calibration.
Rock Wool Calibration
The calibration equation for Rock Wool is the simple linear expression,
VWC = VWCn + (0.0255 * VWCn + 3.7)
Where VWC is the calibrated Volumetric Water Content expressed as a percent and VWCn is the native VWC percent reading from the sensor. The graphs shown in figures 14-22 were made using this calibration.
For most applications the reported PWEC is sufficiently accurate that no calibration is needed for either mineral soils, rock wool or organic material.
Troubleshooting and Support
SDI-12 Voltage, Current, Addressing, and Connectivity
The sensor will fail to operate if the voltage at the cable entry falls below 6 volts during its operation. Overloading the SDI-12 bus with too many sensors operating simultaneously can cause voltage drops on the cable that will cause sensors to fail. High resistance wiring and overly long cables can lead to this problem. Loose connections in splices and connectors will also result in this behavior.
Sensors must be uniquely addressed to the numerals 0 to 9, upper case alphabetical characters A to Z or lower-case alphabetical characters a to z. Duplicate address on the SDI-12 cable will cause the duplicate address to fail.
Ensure that the output impedance of the power supply feeding the SDI-12 cable is below 1 ohm. When the sensor begins taking a reading a current spike of 200 mA can occur causing a 0.2-volt drop in the power line if the impedance of the power supply is 1 ohm.
Do not use cable lengths longer than 200 meters per the SDI-12 specification, cables any longer can cause timing errors to occur.
Reading Accuracy
If you have confidence in the real water content of the soil and the sensor is reporting a different value, the possible causes of the discrepancy might be one of the following:
- The sensor might be inserted into a portion of the block where the water content is lower or higher than the average block. This will happen if there is an air inclusion in the block material – indicating that the block was not thoroughly hydrated.
- The block has a significant non-homogenous density distribution causing some areas to hold more water than others.
- The sensor is not inserted horizontally into the substrate. Installing a waveguide vertically may cause the tips of the waveguide to reside in a different water content zones than the remainder of the waveguide, causing erroneous readings.
All these maladies can be cured by re-hydrating the block or moving the sensor waveguide insertion point to a different face of the block assuring that it is parallel to the table.
Reading Noise
As the conductivity of the water in the substrate increases, the waveform amplitude is diminished. At BEC levels above 3000 uS/cm the reflected wave becomes so attenuated that it becomes difficult to discern. This causes the readings to be noisy. Successive readings can differ from each other on the order of one percent. Note that PWEC at this point will likely be in the range 10,000 to 20,000 uS/cm and is not considered a healthy environment for the plants. If quiet readings are needed in this range use the aM1! Command. This will quiet the readings through statistical analysis but will increase the reading time and energy consumption by a factor of 4.
Unreasonable Spikes or Dropouts in Reading Values
At extremely high EC levels the waveguide becomes essentially shorted out and the reflected wave are attenuated to where it is no longer discernable. This will occur at BEC levels beyond 6,000 uS/cm which would relate to PWEC levels in the 15,000 to 30,000 uS/cm range. The aM1! Command will not be able to resolve it. The sensor will generally be unresponsive or report VWC as 105% and can possibly alternate between no reported reading and 105% readings in an unstable manner. This is a serious stress condition for plants as well as for sensors and should be avoided if encountered. The solution to this problem is to dilute the salts out of the substrate and bring the EC levels down to reasonable levels.
Caution:
When using the TDR sensor to replace a Gaussian sensor care must be taken to avoid using the PWEC thresholds derived with the Gaussian sensor to control nutrient applications with the TDR sensor. As can be seen in Figures 11, 13, 17, 19, 21 and 23 the reported PWEC from the particular deployed Gaussian sensor is very high, especially at lower VWC levels. Any control data gathered by such a sensor leads one to believe that the PWEC level is several times higher than what it really is. If PWEC thresholds are set from such data for controlling PWEC using a TDR sensor, the resulting extreme PWEC condition can overstress the crop and can result in TDR sensor VWC and PWEC reporting failure.
Any other issues that you may encounter that are not resolvable using the above tips should be brought to our attention. We want to hear about them and help you and us resolve them. Please contact us through your distributor or call us directly at (208) 887 1470 or visit us at www.acclima.com.